6/11/22. Weekly Wrap - Week ended 4/11/22.
XJO Monthly Chart.
It remains in a down-trend, below the 8-Month Exponential Moving Average and below both Supertrend Lines. This down-trend started over a year ago.
The average bear market is 289 days - or about nine months. We may be seeing a sustainable rebound - but after only one week in November, it is too early to say.
XJO Weekly Chart.
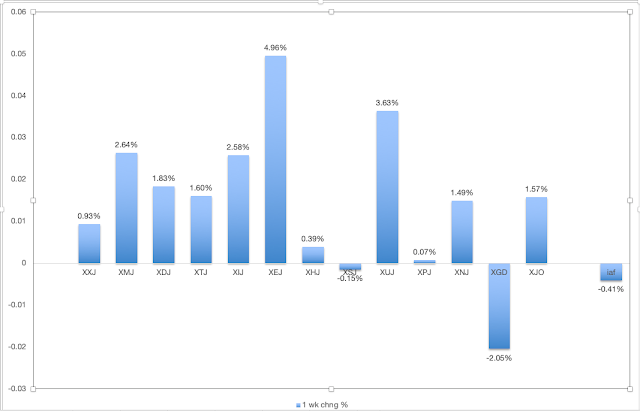
XJO had a good week this week with the index up +1.57% after being up +1.63% the previous week. The two Supertrend Lines on this chart are yellow, i.e., up-trending.
Commodities Index Daily Chart
DBC was up +3.38% on Friday. Friday's candle looks like a rocket launch into outer space. In the previous three months, the best DBC could do was about +2.75% (three times).
That should also launch our energy and mining stocks up higher.
BHP was up +9.75% higher in the U.S. on Friday night. Don't expect the same result in Australia on Monday - but it will be a lot higher than it closed on Friday.
ASX Sector Results for this week.
Relative Strength of Sectors.
RSI (Relative Strength Index) is calculated using the default setting of 14 days - almost three weeks of trading. It provides a more reliable guide to changes in sectors than the one-week results which can jerk around quite a lot and, thus, RSI is probably a better guide to recent strength in the sectors. (Click here for a description of RSI.)
Nine sectors out of eleven are above the 50 level - that represents a bullish result. That's a dramatic improvement from tow weeks ago when only two sectors out of eleven were above 50. Leadership is held by Energy (XEJ) Financials (XXJ). Look to buy pull-backs in strong stocks in those two sectors.
NewHighs-NewLows Cumulative.
This is a lagging indicator but bullish signals are usually highly reliable.
This is a metric for the long-term investor. While NH-NL Cumulative remains below its 10-Day Moving Average, it is best for long term investors to remain cautious and defensive regarding the market.


