Thursday, October 13, 2022

Finspiration Australia. Chart Analysis for Australian and International Stock Markets + Bitcoin.

14/10/22.  Weird session on Wall Street brings big positive returns.


 Dow Jones +2.83%.  SP500 +2.6%.  Nasdaq 2.23%.  Small Caps +2.54%.  Banks +5.19%.

Inflation figure came in at 8.2% above the expected 8.1%.  The stock market sold off initially and was down >2% but then reversed to produce a massive swing to the upside.  

Blogger is playing up again like it did a couple of weeks ago.  I can't load charts any more so I'll terminate today's Blog here - except to say, I believe we will see at least a massive counter-trend rally here and likely the end of the bear market.


Finspiration Australia. Chart Analysis for Australian and International Stock Markets.

 13/10/22.  Australian market finished flat today.


For the second day in a row, XJO finished flat.  Today it was down just 0.07%,

Tonight in America, the Consumer Price Index will be issued.  No doubt that has been a factor in the last two days where little movement has occurred.  We might see some bigger moves after tonight.

Breadth today has been poor with nine out of eleven sectors losing ground. Financials (XXJ) saw a positive day recording +1.4%.  The only other positive sector was Consumer Discretionary (XDJ) up just +0.1%.

Wednesday, October 12, 2022

Finspiration Australia. Chart Analysis for Australian and International Stock Markets. + Bitcoin

 13/10/22.  Overnight in America - stocks sustain small losses.


Dow Jones -0.1%.  SP500 -0.33%.  Nasdaq -0.09%.  Small Caps -0.66%.  Banks -0.14%.

SP500.


Last night was a narrow range day - expect a wider range tomorrow.

XP500 is oversold - it can remain so for long periods of time - particularly in a bear market.

Wait.

Commodities.


Commodities Index finished flat 0.00%.  Energy -0.24%.  Base Metals +1.71%.  Agriculture -0.79%.  Gold +0.53%.

XJO has opened flat today.  Little movement is expected.

BITCOIN.


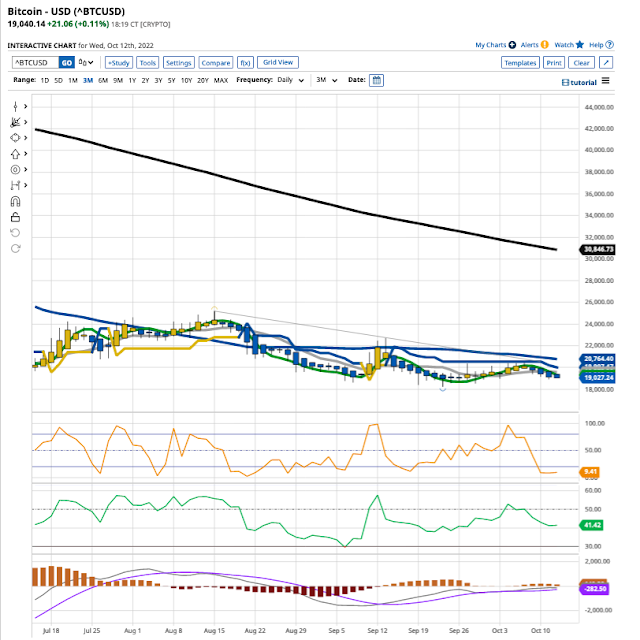
Bitcoin was afflicted by the same malaise as Stocks and Commodities.  Little movement.  It remains in a short-term down trend and a longer-term down trend.

Finspiration Australia. Chart Analysis for Australian and International Stock Markets.

 12/10/22.  ASX finished flat today.


XJO experienced choppy trading today finishing with a narrow range day.  XJO +0.04%.

Energy and Miners were week, Financials just kept the market afloat.  XXJ +1.9%.  XEJ -1.5%, XMJ -0.9%.  XIJ (Info Tech) was also down -0.9%.

Breadth was week.  NH/NL = 513/818   = 38.5%.

NH/NL Cumulative:


This graph continues to present a pessimistic view for long-term investors.

Early in European trading, stocks are relatively flat after early gains.


Tuesday, October 11, 2022

Inspiration Australia. Chart Analysis for Australian and International Stock Markets + Bitcoin.

 12/10/22.  U.S. stocks finish mixed.


Dow Jones +0.12%.  SP500 -0.65%.  Nasdaq -$1.1%.  Small Caps +0.25%.  Banks -2.06%.

SP500


SP500 is now down to horizontal support - the low in early October.

The fast Stochastic that I use is now down in the oversold region.  We can now look for a bounce back above 20 for a short-term upside trade.  Stochastic can, however, stay oversold for long periods of time.

RSI shows a small positive divergence, and MACD is showing a big positive divergence from early September.

Wait.

Commodities.


Commodities did poorly last night.  Commodities Index-1.44%.  Energy -1.79%.  Base Metals -0.98%.  Agriculture -0.39%.  Gold -0.21%.

After 15 minutes of trading, XJO is down a little -0.11%.  

Bitcoin.


Above is an Heiken-Ashi chart for Bitcoin in USD.  It lags a little but is good for showing trends.

Bitcoin remains in a short term down trend, and a longer term down trend.  Unless you are a nimble trader, it's best to leave this along for the time being.

Stay safe.

Finspiration Australia. Chart Analysis for Australian and International Stock Markets.

 11/10/22.    XJO fell today after being up +0.6% in early trade.

XJO fell -0.33% today.  A disappointing result after being up early in trading.

Supertrend line has turned bearish and Hull MA13 has turned down.  Both of those are short-term trend indicators.

The Index remains above the 10-Day MA which could provide some support.  If that fails then we'll be looking at a test of the Oct. 3 low.

Important economic data is released in the U.S. tonight, e.g., economic optimism index and consumer inflation expectations.  It could be a busy night for U.S. Stocks.

European exchanges have opened lower tonight.  London's FTSE, for example, is down -1.5%.

It looks like the intra-day fall in Australia was pre-empting overseas weakness.


Monday, October 10, 2022

Finspiration Australia. Chart Analysis for Australian and International Stock Markets + Bitcoin.

11/10/22.  Weak results in the U.S. with low volume due to Columbus Day holiday.


 Dow Jones -0.32%.  SP500 -0.75%.  Nasdaq -1.04%.  Small Caps -0.01%.  Banks -0.79%.

SP500


SP500 is back to horizontal support but has broken below the Supertrend Line.

Plenty of resistance lies overhead.  The Fast Stochastic I use (bottom panel) usually has to dip below 20 before a rebound occurs.

Providing some optimism is the positive divergence on CCI.

Commodities.


Commodities were mostly lower.  Commodities Index -1.12%.  Energy -2.11.  Base Metals -0.16%.  Agriculture +1.19%.  Gold -1.52%.

Iron Ore +1.8%.

Overnight Oz Futures up +0.2%.  Despite the weak lead from the U.S., ASX has opened on the high side, with XJO up +0.7%.

Bitcoin.

Bitcoin continues to languish with low conviction trading.


Bitcoin is in a short-term down-trend in relatively sideways trading.

Until BTC gets back above the Kumo Cloud, it is best to leave this to short-term traders.

Finspiration Australia. 14/11/23. Tues. Morning Report.

Mixed Results in New York.  Energy up. NAB ex-dividend today. Dow Jones +0.16%.  SP500 -0.08%.  Nasdaq -0.11%.  Small Caps -0.07%.  Banks -0...