Tuesday, October 11, 2022

Inspiration Australia. Chart Analysis for Australian and International Stock Markets + Bitcoin.

 12/10/22.  U.S. stocks finish mixed.


Dow Jones +0.12%.  SP500 -0.65%.  Nasdaq -$1.1%.  Small Caps +0.25%.  Banks -2.06%.

SP500


SP500 is now down to horizontal support - the low in early October.

The fast Stochastic that I use is now down in the oversold region.  We can now look for a bounce back above 20 for a short-term upside trade.  Stochastic can, however, stay oversold for long periods of time.

RSI shows a small positive divergence, and MACD is showing a big positive divergence from early September.

Wait.

Commodities.


Commodities did poorly last night.  Commodities Index-1.44%.  Energy -1.79%.  Base Metals -0.98%.  Agriculture -0.39%.  Gold -0.21%.

After 15 minutes of trading, XJO is down a little -0.11%.  

Bitcoin.


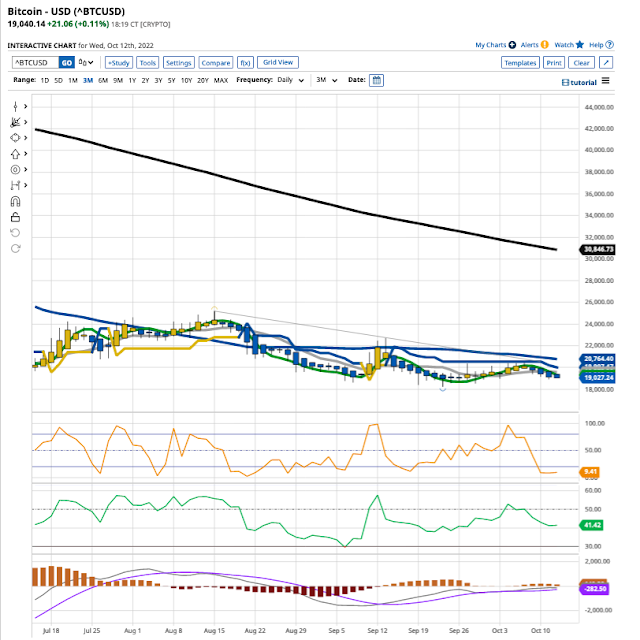
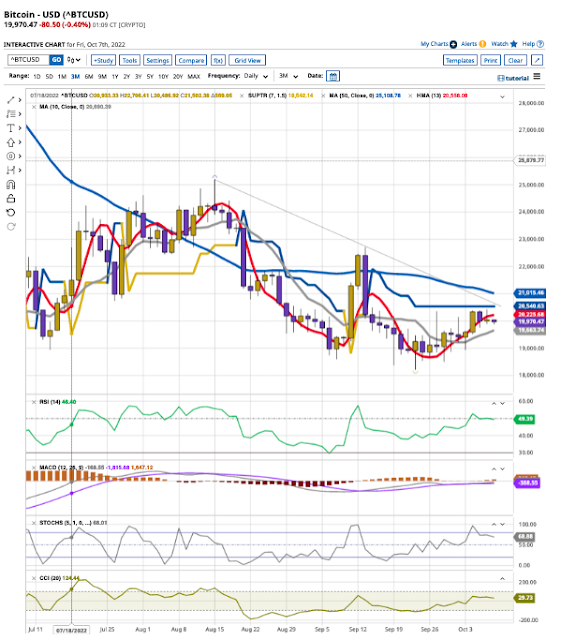
Above is an Heiken-Ashi chart for Bitcoin in USD.  It lags a little but is good for showing trends.

Bitcoin remains in a short term down trend, and a longer term down trend.  Unless you are a nimble trader, it's best to leave this along for the time being.

Stay safe.

Finspiration Australia. Chart Analysis for Australian and International Stock Markets.

 11/10/22.    XJO fell today after being up +0.6% in early trade.

XJO fell -0.33% today.  A disappointing result after being up early in trading.

Supertrend line has turned bearish and Hull MA13 has turned down.  Both of those are short-term trend indicators.

The Index remains above the 10-Day MA which could provide some support.  If that fails then we'll be looking at a test of the Oct. 3 low.

Important economic data is released in the U.S. tonight, e.g., economic optimism index and consumer inflation expectations.  It could be a busy night for U.S. Stocks.

European exchanges have opened lower tonight.  London's FTSE, for example, is down -1.5%.

It looks like the intra-day fall in Australia was pre-empting overseas weakness.


Monday, October 10, 2022

Finspiration Australia. Chart Analysis for Australian and International Stock Markets + Bitcoin.

11/10/22.  Weak results in the U.S. with low volume due to Columbus Day holiday.


 Dow Jones -0.32%.  SP500 -0.75%.  Nasdaq -1.04%.  Small Caps -0.01%.  Banks -0.79%.

SP500


SP500 is back to horizontal support but has broken below the Supertrend Line.

Plenty of resistance lies overhead.  The Fast Stochastic I use (bottom panel) usually has to dip below 20 before a rebound occurs.

Providing some optimism is the positive divergence on CCI.

Commodities.


Commodities were mostly lower.  Commodities Index -1.12%.  Energy -2.11.  Base Metals -0.16%.  Agriculture +1.19%.  Gold -1.52%.

Iron Ore +1.8%.

Overnight Oz Futures up +0.2%.  Despite the weak lead from the U.S., ASX has opened on the high side, with XJO up +0.7%.

Bitcoin.

Bitcoin continues to languish with low conviction trading.


Bitcoin is in a short-term down-trend in relatively sideways trading.

Until BTC gets back above the Kumo Cloud, it is best to leave this to short-term traders.

Finspiration Australia. Chart Analysis for Australian and International Stock Markets.

 10/10/22.  ASX falls heavily today after weak results in the U.S. on Friday.


Above is an Heiken-Ashi Chart for the XJO which shows the index reversing from previous highs.  That's confirmed by a turn down in the RSI and Stochastic.  Expect more downside.

Breadth was poor today with all eleven sectors losing ground.  Advances/Declines = 364/968.  Expect more downside.


Sunday, October 9, 2022

Finspiration Australia. Chart Analysis for Australian and International Stock Markets.

Weekly Wrap, Week ended 7 October, 2022.  Is the Bear finished?

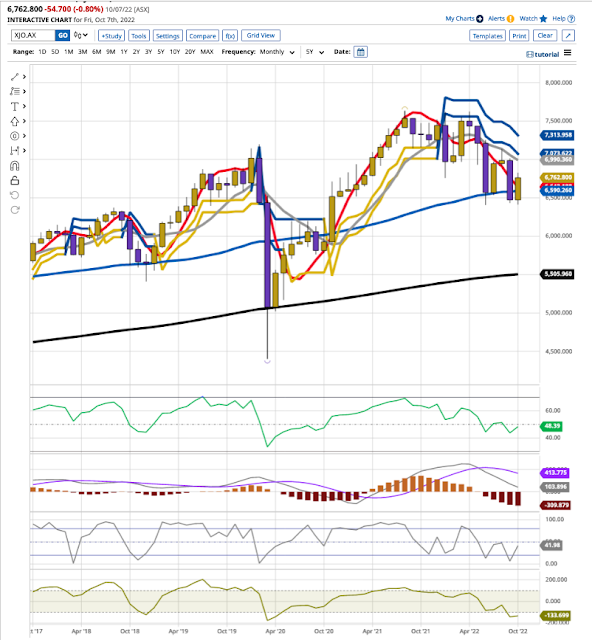
XJO Monthly Chart.

XJO has made a good start to the month, but this is only Week One of October.  We take no action on the basis of this chart until the end of the month.

Currently, the chart remains in a down-trend despite the solid action in the past week.

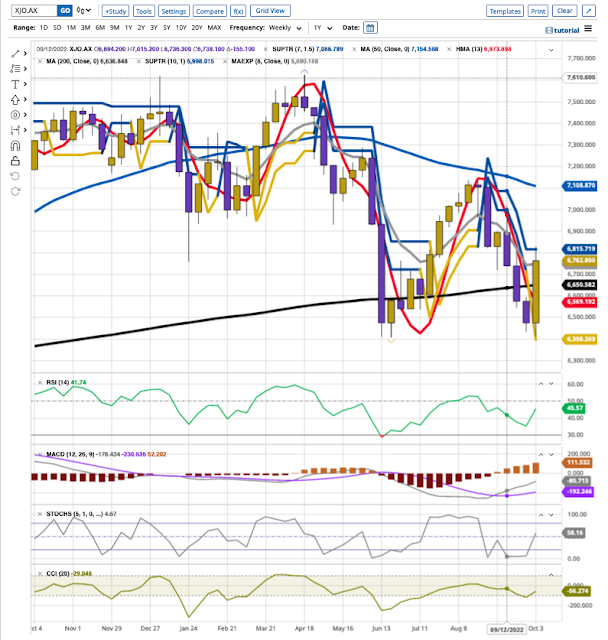
XJO Weekly Chart.


XJO had a strong rally this week, up +4.46% and erased big losses from the previous two weeks.

This week's candle has crossed above the 8-Week EMA, albeit only marginally.  One of the two Supertrend lines has switched from blue (bearish) to yellow (bullish).  XJO has run into the resistance of the other Supertrend lines.

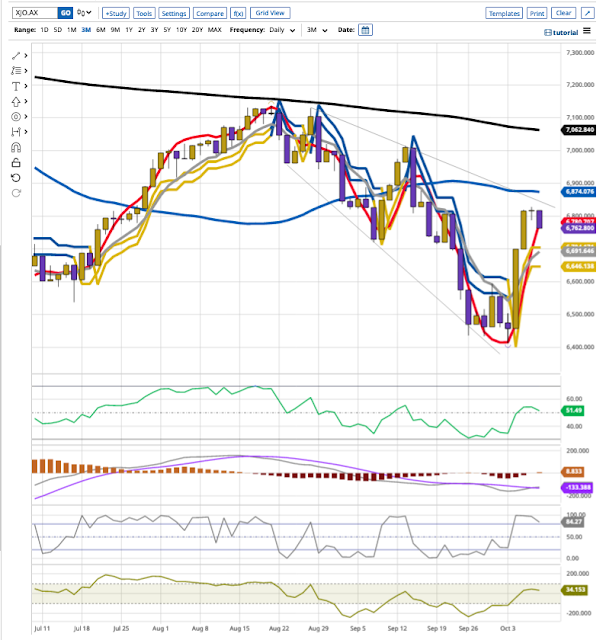
XJO Daily Chart.


XJO was up strongly on Tuesday and Wednesday, but the action on Thursday and Friday suggests that momentum has waned.

The Index remains within the confines of the descending broadening wedge shown on the chart.  A break to the upside of that wedge would be bullish, but then it faces the resistance of the 200-Day MA.  As a general rule, it is best not to enter long-term positions while the chart is below the 200-Day MA.

Despite the good rally this week, the chart remains in a down-trend with lower highs and lower lows.

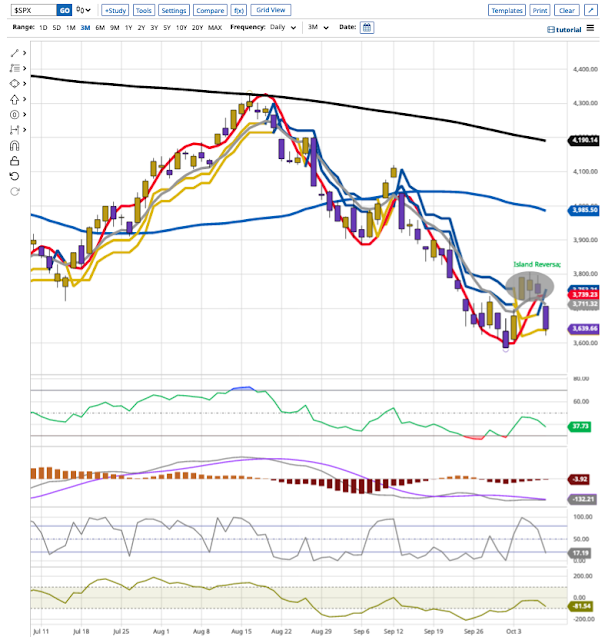
SP500 Daily.


Friday in America was Jobs Report Day.  The jobs outlook was good - which was bad news for stocks because it suggested that the Federal Reserve had economic room to continue with their tough line on inflation.  So stocks sank.

The chart has now formed an Island Reversal pattern.  Candles for Tues/Wed/Thurs have been left isolated with gaps before and after those three days.  Such a pattern has a poor prognosis for stocks.

That big down day on Friday will almost certainly flow through to Australia on Monday, confirming the reversal of momentum suggested by action in Australia on Thursday and Friday.  

The Bear continues to live - for now.

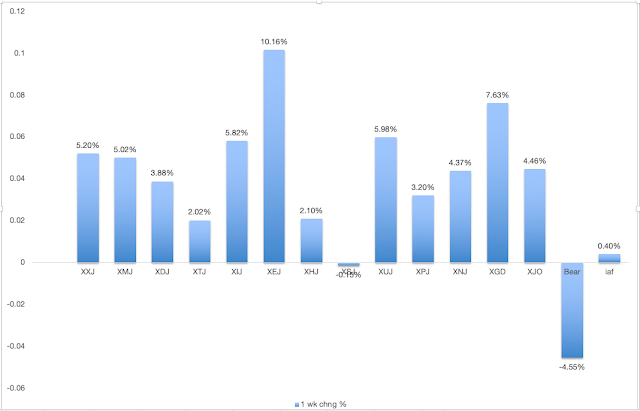
ASX Sector Results for this week.


Ten out of eleven sectors were up this week with some stunning results, led by Energy >10% to the upside.  Five sector rose by >5%.  Only one sector was down - Consumer Staples, and it was down only marginally -0.15%.  That sector was hampered by poor results in the two big retailers, Coles and Woolworths.

We often see such sharp rises during bear markets.  They can trap traders/investors into thinking that the bear market is over.  

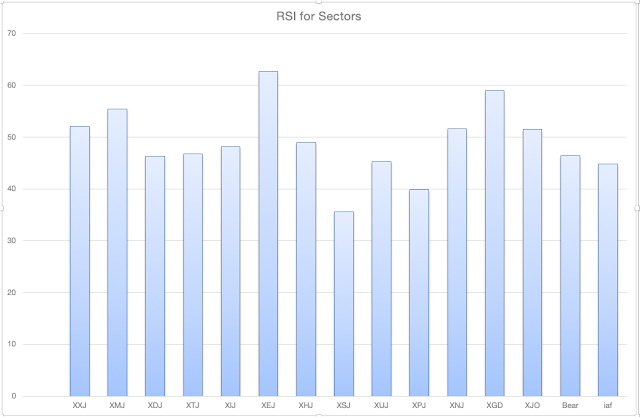
Relative Strength of Sectors.

RSI (Relative Strength Index) is calculated using the default setting of 14 days - almost three weeks of trading.  It provides a more reliable guide to changes in sectors than the one-week results which can jerk around quite a lot and, thus, RSI is probably a more reliable guide to recent strength in the sectors. (Click here for a description of RSI.)


Four sectors out of eleven are above 50:  Financials (XXJ), Materials (XMJ), Energy (XEJ) and Industrials (XNJ).  That is an improvement, however, from a couple of weeks ago when all eleven sectors were below 50.

This can be taken as a measure of breadth in the market.  With seven sectors below 50 and four sectors above 50, the market remains bearish.

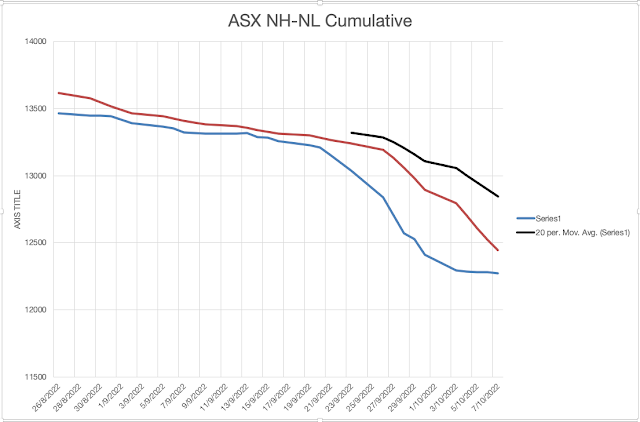
NewHighs-NewLows Cumulative.


This is a metric for the long-term investor.  While NH-NL Cumulative remains below its 10-Day Moving Average, it is best to remain cautious and defensive regarding the market.

% of Stocks above key moving averages.

1.  % of stocks above 10-Day Moving Average: Last Week 13%, This Week 76%.  This result reflects the sharp upside rally seen in the ASX this week.  This is a short-term measure and is bordering on overbought.
2.  % of stocks above 50-Day Moving Average, Last Week 12%, This Week 26%.  This remains bearish.
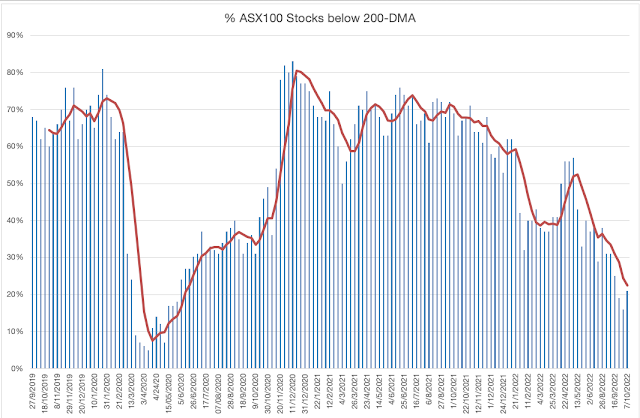
3.  % of stocks above 200-Day Moving Average, Last Week 16%, This Week 21%.  That's an improvement but still bearish.


The long term metric (% Stocks below 200-Day MA) remains very bearish.  I'd like to see this above at least 40% before feeling comfortable.

Conclusion.
 
ASX experienced a sharp upside rally this week and one could be forgiven for thinking that the bear had been vanquished.  But action in America on Friday after the Jobs Report suggests the Bear is alive and kicking.

Stay Safe.


Friday, October 7, 2022

Finspiration Australia. Chart Analysis for Australian and International Stock Markets + Bitcoin.

 8/10/22.  Overnight in America.  Indices retreat from 20-DMA.


Dow Jones -2.11%.  SP500 -2.8%.  Nasdaq -3.8%.  Small Caps -2.43%.  Banks -2.27%.

The Jobs Report came out at 8.30 a.m. NY time.  The jobs market remains strong.  The market didn't like what it saw, expecting no easing of interest rate rises, gapped down at the opening and kept going down.

SP500.


The 20-DMA resistance level has proved too much for the SP500.  It gapped down at the opening and continued its fall.  A test at least of the recent low 0f 30 Sept. seems assured.  Further downside after that is likely.

Commodities.


As usual, Commodities Index +1.05% was dominated by a rise in Energy +2.07%.  Base Metals -2.24% went the other way.  Agriculture flat +0.15%.  Gold -1.1%.

In Australia yesterday.


XJO down heavily yesterday, -0.8%.  It remains in its expanding, descending wedge, so another leg down seems likely.  

I'll be looking for a bounce about half-way down to the lower edge of the wedge.  If that happens we might see a break to the upside of the wedge.  Wait.

Bitcoin.


Bitcoin has retreated from resistance of the Supertrend (7/1.5).  Expect more downside.


Thursday, October 6, 2022

Finspiration Australia. Chart Analysis for Australian and International Stock Markets + Bitcoin.

7/10/22.  Overnight in America, Stocks were weaker.


Dow Jones -1.15%.  SP500 -1.02%.  Nasdaq -0.68%.  Small Caps -0.58%.  Banks -1.88%.

SP500


 SP500 recorded an "inside" day, i.e., the day's range was inside the range of the previous day.  That suggests indecision.

The past three days have recognised resistance at the 20-DMA and Supertrend 11/2.

The chart pattern looks like a bull flag.  If SP500 can get over dual resistance we should see more upside.

Commodities.


Commodities Index +0.63%.  Energy +1.37%.  Base Metals -1.47%.  Agriculture -0.44%.  Gold flat -0.11%.

After almost one-hour of trading, XJO is down -0.6%.  Only one sector is up, Energy +1.08%.  The past five days have seen Energy up more than +10%.

Bitcoin.


Bitcoin is in a short-term up-trend but running into trouble at resistance of the Supertrend (7/1.5).

If it gets over that (unlikely) it still faces resistance from the oblique restraining line from mid-August and then the 50-Day MA.  Nothing is impossible - but this looks a tough ask.


If you saw this Blog earlier today, no charts appeared.  That was a problem with Goggle Blogger which has now been resolved.


Finspiration Australia. 14/11/23. Tues. Morning Report.

Mixed Results in New York.  Energy up. NAB ex-dividend today. Dow Jones +0.16%.  SP500 -0.08%.  Nasdaq -0.11%.  Small Caps -0.07%.  Banks -0...