Monday, September 19, 2022

Finspiration Australia. Chart Analysis for Australian and International Stock Markets. +Bitcoin.

 19/9/22.  XJO down modestly today.


XJO was down a modest -0.28%.  It is down, more or less, to horizontal support.  The Index is oversold on the RSI at 38.88.  That suggests that the next move will be to the upside.

The two biggest sectors (Financials and Materials) were dead flat today, both 0.00%.

There's not much that can be read into today's narrow range action - except we can expect a widening of action tomorrow.  Given horizontal support on the XJO and oversold reading of the RSI - tomorrow is likely to be up.

Sunday, September 18, 2022

Finspiration Australia. Chart Analysis for Australian and International Stock Markets. +BITCOIN.

Weekly Wrap for Bitcoin.

Monthly Chart:


 The long term (monthly) chart of Bitcoin has come back down to the top set back in late 2017.  It's not surprising that Bitcoin is consolidating at this very important level.

It is also conspicuous that no sudden rebound has occurred.  That doesn't mean it can't.  But - at this stage, consolidations at the low suggest more down side.

Weekly Chart.


BTC is an unusually long sideways consolidation.  It remains bearish, however, with two Supertrend lines both blue (bearish).

It is looking remarkably like a Wickoff Consolidation rather than a Distribution.  So we could see a strong upside move from here.

Daily Chart.


MACD Histogram is positive.  That's a sign that downside momentum is easing.

RSI is at 44.57, still shy of the 50 level needed for a positive reading.

Stochastic is close to a +ve cross-over.

If all three go +ve, expect a tradable medium-term rally.

Saturday, September 17, 2022

Finspiration Australia. Chart Analysis for Australian and International Stock Markets +Bitccoin.

        Weekly Wrap - Week ending 15 September, 2022.  Things are Crook in Tullarook.

XJO Monthly Chart.

We have had a little over two week's action in the month of September.  Action should only be taken on this chart at the end of the month.  The monthly chart does, however, let us see the long term picture for the XJO.


Both Supertrend Lines remain blue (bearish).  The chart remains below the 8-Month EMA which is heading downward, i.e. bearish.  Hull MA13 is headed down - bearish.

The XJO found support at the 50-Month EMA where it also found support back at the end of 2018.  In that case, the XJO continued on up for several months.  In this case, XJO has resumed its descent after two months.d  The chart seems likely to head down for another test of the 50-MEMA.

In the very very long-term, XJO found support after its bear market of 2020 at the 200-Month EMA.  That looks like the support which might avoid a catastrophic fall for the XJO.

Weekly Chart.


XJO was down this week, -2.25% easily erasing the gains of the previous week of +0.96%.  The chart remains bearish.

XJO found resistance at the 50-Week MA.  Two Supertrend lines have turned blue - bearish.  Hull MA13 has turned down - bearish.

The Weekly Chart is in sync with the Monthly Chart - both Bearish.


Daily Chart.


XJO had a strong down day on Wednesday and we saw carry-through buying on Friday. Wednesday's action switched the two Supertrend Lines to blue - bearish.  Hull MA13 has turned down - bearish.  

Next horizontal support level is nearby at 6720 (round figures).  XJO finished the week at 6740 (round figures).  After that is a big congestion zone on the left of the chart.  Round figures - the congestion zone takes up space from 6600-6700 about 100 points.  If the XJO does break nearby horizontal support, that congestion zone is likely to produce consolidation or, more likely, a rebound in the index.

The Daily Chart is back in sync with the Weekly and Monthly Charts.  That supports the view that we will see some downside in the short-term, before we get a rebound.

SP500 Daily.


SP500 finished the week opposite the big congestion zone set up inJune/July 2021.  That is likely to provide support for the Index.

Friday finished the week with a "hanging man" candle.  Coming at the low end of a trend, such a candle often indicates a possible rebound.  RSI is oversold, which strengthens the case for a rebound.

Next Federal Reserve meeting is 20/21 September, with an interest rate change scheduled for 21 Sept.  That could be a catalyst for a change in the SP500.  The market seems to be pricing in a 75 basis point rise in the interest rate set by the Federal Reserve.  Less than that would create a short squeeze on stocks.  I doubt that is going to happen

Sector Strengths by RSI.


RSI (Relative Strength Index) is calculated using the default setting of 14 days - almost three weeks of trading.  It provides a more reliable guide to changes in sectors than the one-week results which can jerk around quite a lot and, thus, RSI is probably a more reliable guide to recent strength in the sectors. (Click here for a description of RSI.)

Eleven of eleven sectors have readings below 50.  50 is often regarded as  dividing line between bullish and bearish. With all sectors below 50, we have a very bearish market with weak breadth.

Last week, no sector was below 30 - the extremely oversold level.  This week we have four sectors below 30 - XTJ, XHJ, XUJ and XPJ.  XSJ and XDJ (the big retailers) are just above the 30 level.  

This is an exceptionally weak market with poor breadth.


Breadth:

    1. New Highs - New Lows Cumulative.


This week we had 2 strong stocks and 51 stocks.  That's very poor breadth for this metric.  This has plunged sharply down from its 5-Week MA.

Cumulatively:


This chart remains below its Five-Week MA, which is a bearish reading.  This is a reasonable guide for medium term traders.


% of Stocks above key moving averages.

1.  % of stocks above 10-Day Moving Average: Last Week 13%, This Week 5%.  That's the worst reading since 28/1/22, which marked the end of the Jan. 22 fall.
2.  % of stocks above 50-Day Moving Average, Last Week 25%, This Week 11%.  That's the worst reading since April 2020 - when XJO was coming out of the Mar. 2020 bear market.
3.  % of stocks above 200-Day Moving Average, Last Week 25%, This Week 19%.  That's the worst reading since May, 2020.

Momentum is now nearly as bad as we saw at the end of the 2020 bear market.  We can't be far off  an end to this down trend.

Australian Consumer Confidence.

Conclusion.

1.  Monthly, Weekly and Daily Charts are in sync - bearish. Expect more downside.

2.  Breadth has been very poor. Some of the breadth stats are so poor, we may be close to a bottom for this downside cycle.    

3.  Surprisingly, cyclicals are showing better relative strength than defensives.  That may suggest we will see a rebound.

4.  Nh-Nl Cum remains bearish - long term investors should stay cautious about adding new funds

4.  Historically, September is the worst month of the year, so any rebound will probably be sold into.

5.  American Federal Reserve meets in the coming week.  That could be a catalyst for a rebound.

Stay safe.

Friday, September 16, 2022

Finspiration Australia. Chart Analysis for Australian and International Stock Markets + BITCOIN.

17/9/22.  Overnight in America, stocks slip again.


 Dow Jones -0.46%.  SP500 +0.72%.  Nasdaq -0.9%.  Small Caps -0.65%.  Banks -1.51%.

SP500.


Friday's candle presents as a "hanging man" candle, coming at the low end of a trend that often signifies an end to the trend is close.

SP500 gapped down at the opening, sold off, but intra-day buying brought the index back up close to its opening quote.

RSI is oversold.  Both RSI and CCI show positive divergences so a rebound may be a possibility.

Stochastic is down into the oversold area.  That's a "get set" signal, but don't jump the gun.  It can remain oversold for long periods of time.

Commodities.


Commodities Index -0.36%.  Energy -0.62%.  Base Metals flat 0.00%.  Agriculture -0.1%.  Gold +0.55%.

Gold fell heavily on Thursday on bigger than normal volume.  Thursday may have been a wash-out event.

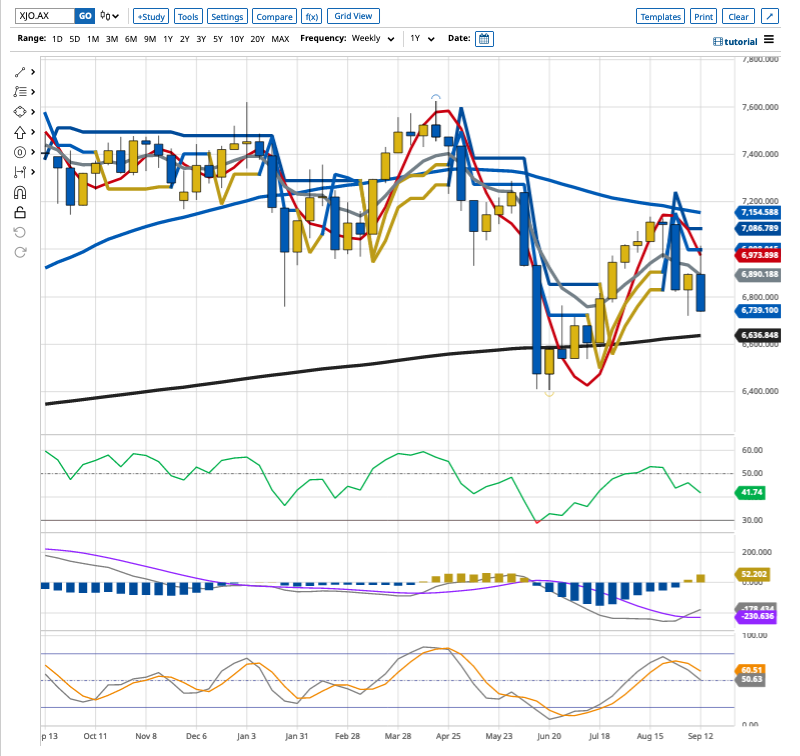
Yesterday in Australia.


XJO down heavily on Friday, -1.52%.  It is below the Kumo Cloud and Supertrend is blue (bearish).

The index is coming down to horizontal support and a major congestion zone over to the left of the chart.  RSI is oversold.

There may be a bit more upside, but a short-term bounce is likely next week.

BITCOIN.


Above is a six-month daily chart of BTCUSD,  From late March to early June, Bitcoin fell heavily.  Since then it has been in a long sideways consolidation.  Short-term it is consolidation at recent lows.

The Crypto could be setting up for a move to the upside with plenty of positive divergences showing on indicators.

Below is a one-year weekly chart of BTCUSD.


The fall from grace for BTC began in early Nov. last year when it topped close to $70,000.  It is now down around $20,000.  

In that time, as shown by the Supertrend Line, BTC has had only one serious attempt at a rebound (in March) which failed.  It's had two consolidation periods since then.  The current one, with BTC oscillating around the 200-Week MA, has lasted a long time by BTC standards.  So it may be due for a move to the upside.  A move back above the Supertrend Line could signal the beginning of a tradable rebound.  I doubt, however, that it will last for long.  Look for resistance at the Base Line of the Ichimoku system - around $32,000.


Thursday, September 15, 2022

Finspiration Australia. Chart Analysis for Australian and International Stock Markets + Bitcoin.

16/9/22.  Overnight in the U.S.  Stocks continue to the downside.  Banks rise.


Dow Jones -0.56%.  SP500 -1.13%.  Nasdaq -1.43%.  Small Caps -0.82%.  Banks +1.37%

European STOXX600 down -0.7%.

10Yr T-Note yield now up to 3.45%.  That had a negative effect on Tech stocks and a positive effect on Banks.

SP500.


SP5500 has nudged below the lower edge of the Kumo Cloud but still, more or less, in line with horizontal support.

CCI is showing a positive divergence so we could get a surprise move to the upside.

Stochastic has fallen into the oversold region - that's a get set sign.  Just don't jump the gun - wait for a move up above 20.  Stochastic can stay oversold for long periods of time.

Commodities.


Commodities Index down heavily, -2.92%, pushed down by a big fall in Energy -3.65%, falling from key moving average resistance.  Base Metals -0.52%.  Agriculture -0.05%.  Gold also down heavily -1.87%.

Iron Ore +0.1%.   Thermal Coal +0.3%.

Overnight Oz Futures -0.6% indicating further falls for the Australian market today.

BITCOIN.


Bitcoin continues to consolidate at lows and remains in its long-term sideways consolidation.  Until we see a move by Bitcoin above the Kumo Cloud and then above the 200-Day MA, it is difficult to see Bitcoin sustaining a bull rally.

Finspiration Australia. Chart Analysis for Australian and International Stock Markets + BITCOIN

 15/9/22.  XJO up modestly today.


Not much joy in that chart, although XJO did rise +0.21%

Today's candle is a narrow range candle.  It has respected the resistance of the lower edge of the Kumo Cloud.

This appears to be a consolidation at the lows of the previous day's plunge.  That suggests we'll see more downside.

Wednesday, September 14, 2022

Finspiration Australia. Chart Analysis for Australian and International Stock Markets +BITCOIN

 15/9/22.  Overnight in America, choppy trading with modest gains in major indices.


Dow Jones +0.1%.  SP500 +0.34%.  Nasdaq +0.74%.  Small Caps -0.02%.  Banks -0.5%.

SP500.


SP500 is consolidating at the lows of yesterday's plunge.  It is finding support at horizontal support and the lower edge of the Kumo Cloud.  We could see more consolidation around this level.

Short term, SPX is bearish with the Supertrend Line switching over to blue.

Commodities.


Commodities Index +0.43%.  Energy +0.52%.  Base Metals -0.31%.  Agriculture -0.63%.  Gold -0.38%.

Iron Ore -1.6%.  Thermal Coal +1.1%.

After twenty minutes of trading on the ASX, the XJO is up +0.3%.

BITCOIN


Bitcoin remains bearish and will remain so while it is below the Kumo Cloud.

It is in a long term sideways consolidation - unusual for this Crypto-currency,

Finspiration Australia. 14/11/23. Tues. Morning Report.

Mixed Results in New York.  Energy up. NAB ex-dividend today. Dow Jones +0.16%.  SP500 -0.08%.  Nasdaq -0.11%.  Small Caps -0.07%.  Banks -0...