Weekly Wrap - Week ending 15 September, 2022. Things are Crook in Tullarook.
XJO Monthly Chart.

Both Supertrend Lines remain blue (bearish). The chart remains below the 8-Month EMA which is heading downward, i.e. bearish. Hull MA13 is headed down - bearish.
The XJO found support at the 50-Month EMA where it also found support back at the end of 2018. In that case, the XJO continued on up for several months. In this case, XJO has resumed its descent after two months.d The chart seems likely to head down for another test of the 50-MEMA.
In the very very long-term, XJO found support after its bear market of 2020 at the 200-Month EMA. That looks like the support which might avoid a catastrophic fall for the XJO.
Weekly Chart.
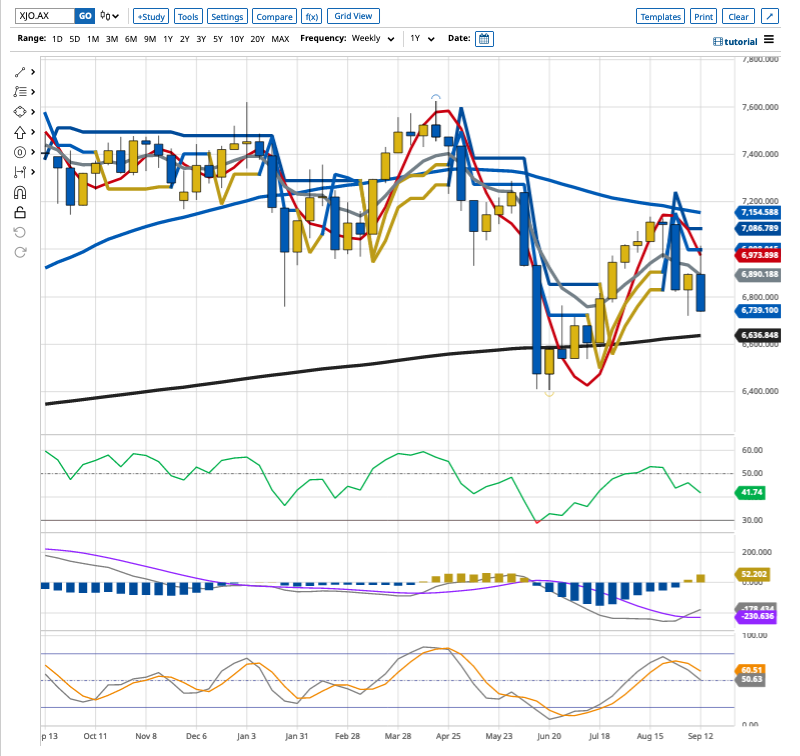


Conclusion.
1. Monthly, Weekly and Daily Charts are in sync - bearish. Expect more downside.
2. Breadth has been very poor. Some of the breadth stats are so poor, we may be close to a bottom for this downside cycle.
3. Surprisingly, cyclicals are showing better relative strength than defensives. That may suggest we will see a rebound.
4. Nh-Nl Cum remains bearish - long term investors should stay cautious about adding new funds
4. Historically, September is the worst month of the year, so any rebound will probably be sold into.
5. American Federal Reserve meets in the coming week. That could be a catalyst for a rebound.
Stay safe.


