Tuesday, August 9, 2022

Finspiration Australia. Chart Analysis for Australian and International Stock Markets.

10/8/22.  Overnight U.S. stocks fall.  Tech hard hit.


Dow Jones -0.19%.  SP500 -0.42%.  Nasdaq -1.19%.  Small Caps -1.44%.  Banks +0.45%.

European stocks also fell with the Euro Stoxx 50 down -1.11%.

SP500.


The modest fall in the SP500 keeps it in short-term and medium-term up-trends.  The longer term remains in doubt with the Index below the 200-Day MA.

The negative divergence on CCI suggests further falls down from the Horizontal Retracement Zone, 50%-61.8% of the fall earlier this year.

Plenty of near-by support may cushion any further falls.

Tonight in the U.S., CPI data is released.  If inflation ticks higher, the Fed. may be more aggressive in its next interest rate rise.

Commodities.  Out of step with Stocks.


Commodities Index +0.93%.  Energy +0.95%.  Base Metals +1.42% and up to the 50-Day MA, Agriculture +0.4%.  Gold tipped above its 50-Day MA, up +0.31%.  Expect more upside in Gold.

Iron Ore -1.5%.  Thermal Coal +3.6%.

Lots of plusses and minuses for Australia in the overnight data.  Stronger base metals, Energy and Banks should limit losses today in Australia.

After 15 minutes of trading, XJO is down -0.47%.  BHP is flat +0.05%, but Rio has risen +0.57%.  


Finspiration Australia. Chart Analysis for Australian and International Stock Markets.

 ASX flat today.


XJO up today +0.13%.  The day's action was contained within a narrow range.

The short-term and medium-term trends remain positive.


While the XJO remains below the 200-Day MA, the long-term trend remains in doubt.

The big news in Australia was the report from NAB.  As usual, the CEO reported how pleased he was with the results.  The market thought otherwise, NAB fell nearly -3%.  Why can't these CEOs be clear about their prospects?

Monday, August 8, 2022

Finspiration Australia. Chart Analysis for Australian and International Stock Markets.

9/8/22.  Overnight Major U.S. Indices more or less flat.


 Dow Jones +0.09%.  SP500 -0.12%.  Nasdaq -0.1%.  Small Caps +0.63%.  Banks -0.53%.

Euro Stoxx 50 finished up +0.85%.

American stocks opened strongly following Europe, but the rally faded after the first half-hour.

SP500


SP500 remains in the Retracement Zone between 50% and 61.8% of the fall from late March to mid-June.  That's also opposite a congestion zone which occurred in late May to early June.

The negative divergence on CCI (bottom panel) suggests the next move will be down.

CPI comes out on Wednesday.  That may be a catalyst for a move in the market - either up or down.

Commodities.


Commodities Index +1.21%.  Energy +1.95%.  Base Metals +0.2%.  Agriculture +0.55%.  Gold +0.85%.

Gold continues to find resistance at the 50-Day MA.  A break above that should see a sustained rally to the upside.

Iron Ore +1.7%.  Thermal Coal +2.8%.

ASX is set to open flat with Overnight Oz Futures down -0.1%.

Finspiration Australia. Chart analysis for Australian and International Stock Markets.

 8/8/22.  ASX finished flat today.


XJO up marginally today +0.07%.

MACD Histogram has turned negative, suggesting the next move will be down.

CCI is also showing a negative divergence.

We'll just have to wait and see how this plays out.  A move above the top of the Kumo Cloud would be bullish.

Energy and Materilas kept the ASX afloat today.  XEJ up +1.9%.  The other resource sector, XMJ, was also strong today, XMJ up +1.8%.

Financials (XXJ), which is the largest of the ASX Sectors, was flat today 0.00%.


Saturday, August 6, 2022

Finspiration Australia. Chart Analysis for Australian and International Stock Markets

    Weekly Wrap - Week ending 5 August, 2022.

XJO Monthly Chart.

We are only into the first week of August, so too early to make definitive statements about the trend.


Both Supertrend Lines remain blue (bearish).  8-Month EMA is headed down.  Hull MA13 is headed down.

  All indicators are on the bearish side.

The XJO is finding support at the 50-Month EMA where it also found support back at the end of 2018.

Weekly Chart.


XJO had a good week, up +1.01   %.  The chart is bullish.

The index has found support at the 200-Week MA and finished above its 8-Week EMA which is pointing up.  HullMA13 has turned up.  


Both Supertrend lines have switched from blue to yellow - bullish.

All of that is bullish.


Monthly and Weekly Charts are out of sync (Monthly - bearish, Weekly bullish) so we are seeing a trend change in the medium term.

Daily Chart.


XJO has finished marginally above resistance at 6982,  but the upside break lacks conviction

Hull MA13, two Supertrend lines and 8-Day EMA are all heading to the upside - bullish.

The short-term trend is bullish but nudging on an overbought reading on the RSI.

Cautionary notes are entering this chart with negative divergences showing up on CCI and MACD Histogram.

The Weekly and Daily charts are both bullish but out of sync with the Monthly Chart.  The most likely scenario is more upside, but there are provisos to keep in mind about that statement.  More on that later in this report.


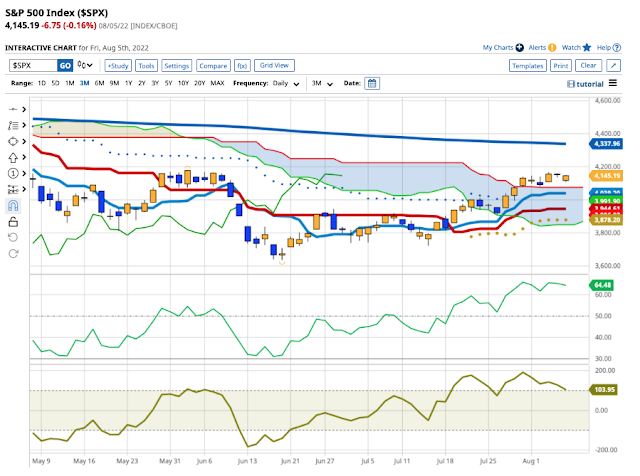
SP500 Daily.


SP500 is bullish in both the Short-term and Medium-Term.  While it remains below the 200-Day MA the Long-term remains in doubt.

Like the XJO, this chart is giving out cautionary signals.  

SP500 is at the 50% resistance line of the fall from March to June.  That also corresponds with the top of the congestion zone which occurred in June.

Negative divergences are showing up on CCI and MACD Histogram, so the current up-trend is under threat from falling momentum.


Sector Strengths by RSI.


RSI (Relative Strength Index) is calculated using the default setting of 14 days - almost three weeks of trading.  It provides a more reliable guide to changes in sectors than the one-week results which can jerk around quite a lot and, thus, RSI is probably a more reliable guide to recent strength in the sectors. (Click here for a description of RSI.)

Ten sectors have readings above 50 - which is taken as a sign of bullishness.  Eight sectors have readings above 60 up from three the previous week.  That's looking a little overcooked to me.

The sector with the strongest momentum is, Financials (XXJ) RSI 69.29, down a little from the previous week when it was above 70 (overbought).   Next best was Health (XHJ) RSI 68.
As a general rule, its best to follow strong stocks in the strongest sectors. 

In XXJ, the two strongest large cap stocks are NAB (RSI 71.1) and AMP (RSI 77.65).  Both of those stocks are now overbought.

In (XHJ), the two strongest large cap stocks are RMD (RSI 68.02) and  Ansel(RSI 67.53 ).  

Do your own research on those stocks.  I've only put up those stocks as examples of a general principle and not a recommendation.

There are other ways of looking at this.  For example, the biggest improver in XHJ was Ramsay Health Care (RHC) where the RSI jumped from 40.86 last week to 66.48 this week.  The biggest improver in XXJ was QBE,  RSI jumped from 43.65 to 56.37 in one week.

Breadth:

    1. New Highs - New Lows Cumulative.

This is one of the important breadth indicators.  Unless breadth is solidly positive, the market is always under threat.


NH-NL Cumulative is in lock-step with its 10-Day Moving Average.  Until we see a clear move above the 10-Day MA - continue to watch.


This metric trends very strongly.  As such it is a valuable guide to the long-term investor, but not much use to the short-term trader.  It gave a timely signal to go long in May 2020, and a sell signal in January 2022.  That's a good run for the long-term investor.

If NH-NL Cumulative gives a new buy signal, I'll put that up on my blog during the week rather than wait for the week-end.


    2.  ASX Advance-Decline Line.

This is another important indicator of breadth.


The ASX Advance-Decline Line turned bullish at the beginning of July, predicting the good month we've seen for stocks in July.  At this stage it remains bullish.  Watch for a turn-down to predict a bearish reversal.


    3. Strong-Weak Stocks Cumulative.


This chart has turned bullish being above its 5-Week MA.   

The Number for SS-WS has now reached 19.  The last two times we saw a number like this (late Apr, 2020 and late Dec. 2021) the market retreated from recent highs.

% of Stocks above key moving averages.

1.  % of stocks above 10-Day Moving Average: Last Week 78%, This Week 80%.
2.  % of stocks above 50-Day Moving Average, Last Week 70%, This Week 75%.
3.  % of stocks above 200-Day Moving Average, Last Week 31%, This Week 43%


These figures suggest that the market is bullish in the short and medium term, but the long-term trend is still in doubt.  That confirms the long/medium/short term experience on the Monthly/Weekly/Daily XJO charts.

The % of stocks above 10-DMA is, however, now into the overbought level of 80, so we can expect a short-term pull-back.

I'd like to see all of these above 50% to feel comfortable about the longer term bull market. 

Conclusion.

1.  Monthly, Weekly and Daily Charts are not in sync, one bearish, two bullish.   Stay with the short/medium term trends until other-wise indicated.

2.  SP500 Daily has been bullish in the short/medium term, but is at a key resistance level.  XJO is in a similar situation.Watch.

3.  Breadth according to Advances-Declines is improving but we still have to wait on NH-NL Cum to break to the upside.

4.  XXJ and XHJ have strongest momentum.  Look to strong stocks in those sectors.  Do your own research on stocks in those Sectors.

5.  In the short-term, the market is looking over-cooked.  I expect a pullback in the coming week.


In America, reporting season continues.  Results, which so far have been generally favourable, will continue to sway the market. 

Friday, August 5, 2022

Finspiration Australia. Chart Analysis for Australian and International Stock Markets.

 6/8/22.  Yesterday in Australia.

XJO up yesterday +0.58%, but still consolidating but finding resistance at the upper edge of the Kumo Cloud.  Breadth was good:  Advances 807, Declines 560.

Resouce Stocks had mixed results with the miners up strongly (XMM +2.17%) but Energy fell (XEJ -1.4%).

Short-term and medium-term the trend is up.  The long-term trend remains in doubt while the XJO is below the 200-Day MA.

Negative divergence on the CCI suggests the XJO will have trouble breaking above the Kumo Cloud.

Overnight in the U.S., results were mixed with Tech weaker, and Industrials stronger.


Dow Jones +0.23%.  SP500 -0.16%.  Nasdaq -0.5%.  Small Caps +0.49%.  Banks very strong ++1.29%.

SP500

The short-term and medium-term trend remains up, but the long-term trend remains in doubt with the XP500 below the 200-Day MA.

SP500 has been consolidating just above the Kumo Cloud, but divergence on the CCI suggests it will have a difficult time maintaining that position.

Plenty of support remains nearby, so any pull-back might be muted.

Commodities.


Commodities Index -0.36%.  Energy fell again, -0.67%.  Base Metals +0.92%.  Agriculture -0.45%.  Gold -1.12%.

Gold is finding resistance at the 50-Day MA.  It tends to be seasonally strong from August to December, so a break above the 50-DMA could see a strong rally into year end.

Based on the Overnight Metals and Banks, Australia should do OK on Monday.


Thursday, August 4, 2022

Finspiration Australia. Chart Analysis for Australian and International Stock Markets.

 5/8/22.  Overnight.  Mixed results in the U.S., Tech up again.

Dow Jones -0.26%.  SP500 -0.08%.  Nasdaq +0.41%.  Small Caps -0.81%.  Banks -1.09%

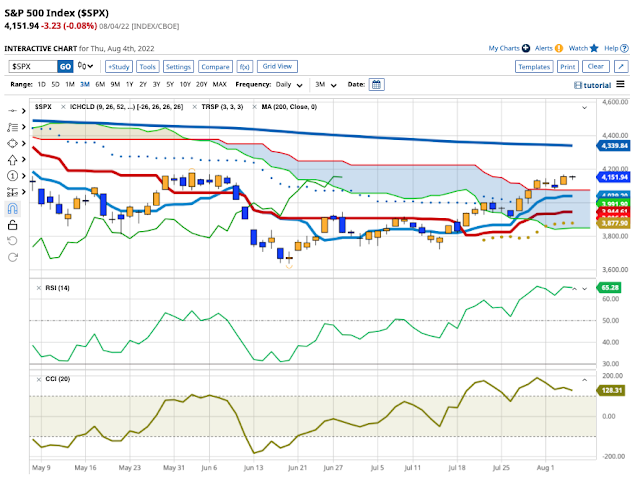
SP500.


Short-term and medium-term trends are up.  The long-term trend remains in doubt while the SPX remains below the 200-Day MA.

Currently, SPX has been consolidating in a narrow range - probably waiting on Jobs numbers on Friday, which will probably be market moving.

Commodities.


Commodities Index (-1.07% continues to weaken under pressure from Energy (-2.53%).  Base Metals went up +1.78%.  Gold also went up +1.65%.  Agriculture +1.52%.

On the ASX today, we can expect a narrow range day.  After 20 minutes of trading today, XJO is up +0.2%.

Finspiration Australia. 14/11/23. Tues. Morning Report.

Mixed Results in New York.  Energy up. NAB ex-dividend today. Dow Jones +0.16%.  SP500 -0.08%.  Nasdaq -0.11%.  Small Caps -0.07%.  Banks -0...