Thursday, August 4, 2022

Finspiration Australia. Chart Analysis for Australian and International Stock Markets.

 4/8/22.  Oz Stock finish marginally higher after intra-day sell-off.


Today was a narrow-range day sitting inside the range of the previous day.  We can expect range expansion tomorrow.

Breadth today was positive 754/577.

Financials (XXJ +0.6%) was a stabilising sector today.

Our market continues to be hostage to the American reporting season.  That makes prediction very difficult.

Wednesday, August 3, 2022

Finspiration Australia. Chart Analysis for Australian and International Stock Markets

4/8/22.  Overnight, U.S. major indices post good rises, led by Technology.


Dow Jones +1.29%.  SP500 +1.56%.  Nasdaq +2.59%.  Small Caps +0.91%.  Banks +1/72%.

SP500.

SP500 remains in short-term and medium-term trends while the long-term trend remains in doubt while SPX remains below the 200 Day MA.

Negative divergences on indicators suggest the next move will be to the down-side.

Commodities.


Commodities Index -0.86% was pulled down by weak Energy -1.6%.  Base Metals -0.31%.  Agriculture +0.41%.  Gold +0.24%.

The start of ASX trading has followed the U.S. higher.  XJO up +0.4%.

Finspiration Australia. Chart Analysis for Australian and International Stock Markets.

3/8/22.  XJO falls after six days to the upside.


XJO down -0.32% and stalling at the top of the Kumo Cloud.

CCI shows a clear negative divergence so we should see some more downside.

Things were a bit weird today.  Advances-Declines was positive 704/617.  NewHighs/NewLows was flat 13/12 and VIX was negative - it usually trends inversely to the XJO.

Materials fell heavily early in the day, down -1.5% but finished up +0.35%.  Technology stocks finished up +2.2% today.  But all the big banks were down.

It's a bit hard to make sense of such data, but the trend is probably going down.

Tuesday, August 2, 2022

Finspiration Australia. Chart Analysis for Australian and International Stock Markets.

 3/8/22.  Overnight:  U.S. stocks finish lower.


Dow Jones -1.23%.  SP500 -0.67%.  Nasdaq -0.16%.  Small Caps -0.84%.  Banks -1.4%.

SP500.

SP500 remains in an up-trend but stalling opposite the congestion zone back in May this year.

Wait.

Commodities.

Commodities Index -0.51%.  Energy +0.12%.  Base Metals -1.79%.  Agriculture -1.4%.  Gold -0.59%.

Gold shows a bearish engulfing candle.  Its upside move appears to have petered out.

None of the above is positive for the Oz market today and, after 20 minutes of trading, XJO is down -0.8%.


Finspiration Australia. Chart Analysis for Australian and International Stock Markets.

2/8/22.  Oz market finishes flat after RBA interest-rate announcement.


The Australian market was weak for most of the day but initiated an up-trend after the RBA announcement on interest rates.

It finished flat on the day +0.07%.

The chart shows a doji candle-stick at the top edge of the Kumo Cloud.  That represents resistance.  We need to see a clear close of the chart above the Kumo Cloud.

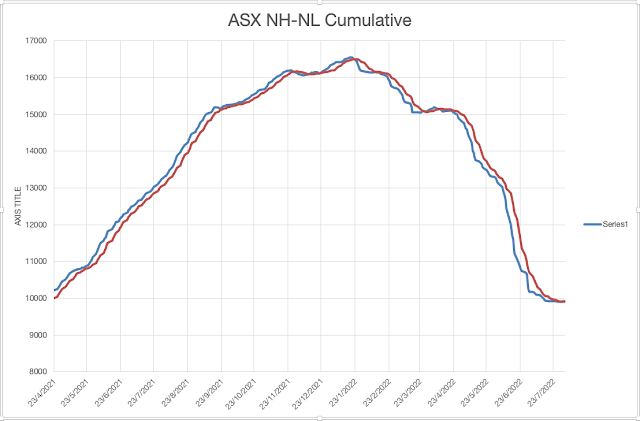
NH-NL continues to show a neutral rating:


Breadth today was slightly negative, Advances/Declines 650/748.  There's not a lot in that figure.


Today's negative figure caused a down turn, but the chart remains bullish.

Monday, August 1, 2022

Finspiration Australia. Chart Analysis for Australian and International Stock Markets.

2/8/22.  Overnight in America stocks slip a little.

Dow Jones -0.14%.  SP500 -0.28%.  Nasdaq -0.18%.  Small Caps +0.21%.  Banks -0.37%.

SP500.


SP500 remains in a short-term up-trend.

Today's doji candle stick suggests indecision and, coming at the top of the trend, may indicate that the trend is ending or, at least consolidating.

Commodities.  Energy falls sharply.


Commodities Index -2.03%.  Energy -2.54%.  Base Metals -0.56%.  Agriculture -1.14%.  Gold +0.57%.

After 10 minutes of trading this morning, XJO is down -0.7%.


Finspiration Australia. Chart Analysis of Australian and International Stock Markets.

1/8/22.  XJO up strongly today +0.7%.  That's five days to the upside.

XJO is now at the top of the Kumo Cloud.  That's a resistance level of some significance.


CCI shows a negative divergence.  That's a cautionary note.


The short-term trend remains up, but under a cloud.  Stay with the trend until it reverses.

NH-NL Cumulative is at a pivotal point.


If you squint your eyes, you can see that NH-NL Cum is now above its 10-Day MA.

That's important - but not definitive of a change in trend.

Watch other indicators for confirmation
 

Finspiration Australia. 14/11/23. Tues. Morning Report.

Mixed Results in New York.  Energy up. NAB ex-dividend today. Dow Jones +0.16%.  SP500 -0.08%.  Nasdaq -0.11%.  Small Caps -0.07%.  Banks -0...