Weekly Wrap - Week ending 24 June, 2022.
XJO Monthly Chart.
The market has four trading days left in June. The chart is bearish.
The monthly chart has broken down from its previous range 6930-7539, and finished the week at 6579.
Both Supertrend Lines have turned blue (bearish). All indicators are on the bearish side.
Weekly Chart.
XJO had a positive week, up +1.6%. The chart, however remains bearish.
The rise this week took the Index back up and is testing the 200-Week Moving Average.
RSI14 is oversold at 32.85 - but it has climbed from below 30 to above 30 - providing some hope of further upside.
Two Supertrend lines, 8-Week MA and Hull MA13 are all bearish.
Monthly and Weekly Charts are in sync - bearish.
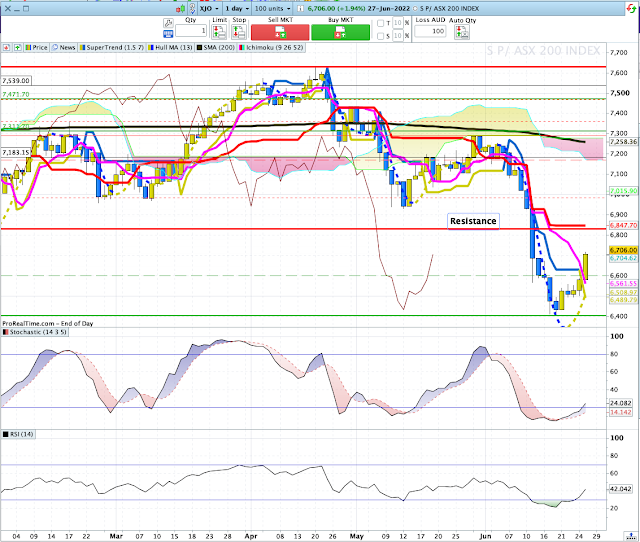
Daily Chart.
XJO is in a short-term counter-trend rally has indicated by Hull MA13 switching from blue (bearish) to yellow (bullish).
Both Supertrend Lines are blue and heading sideways indicating a non-trending market. Chart remains below the 8-DEMA. 8-DEMA is a short-term trigger line. If XJO crosses above that (likely) we should see some more upside.
RSI (14) is at 33.38 - oversold but rising. I'd like to see that back above 50 before thinking of this as more than a short-term counter trend rally.
The medium and long-term trend remains bearish.
All three time frames are in sync - bearish. Only take sell signals. If there is a rebound, look to sell the rally.
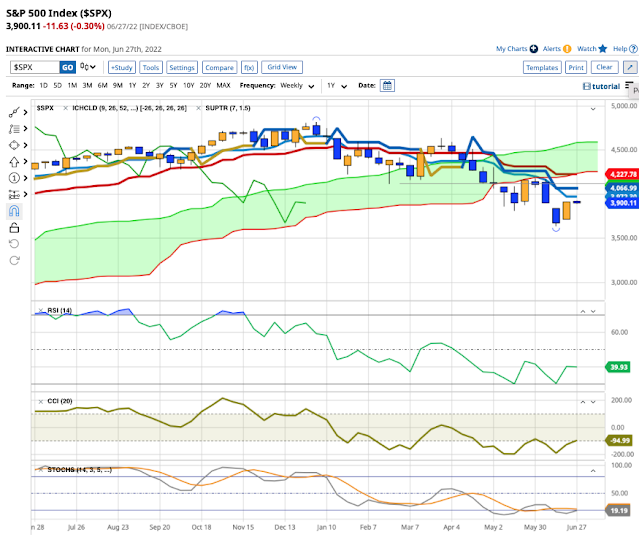
SP500.
On Friday, SP500 had a big upside move, +3.06%. That move switched all the short-term chart indicators from bullish (two Supertrend Lines and 8-DEMA). Stochastic has pulled up above its 20 line.
Plenty of dynamic resistance remains overhead - 20DMA, 50DMA, 200DMA.
We may see more upside but the likelihood of a sustained bullish trend is low.
Sector Changes - past week.
It doesn't take a genius to see that we've had sector rotation this week, out of Resources (Materials and Energy) and into just about everything else.
The worst two sectors were Energy (XEJ -4.55%) and Materials (XMJ -4.88%.
The best two sectors were interest-rate sensitive sectors, Information Technology (+8.09%) and Property (XPJ +7.33%).
Composite Government Bonds were up. IAF +2.21%. That suggests that big investors now think that the worst of the interest rate rises are built into the market. Central Banks tend to lag behind the Bond market. While Central Banks (including the RBA) are hell bent to raise interest rates to tramp down on inflation, they might just be a bit late to the party. It may be too early to say this is now a trend, it is beginning to look that way.
Composite Bonds - IAF.
IAF (Australian Composite Bonds) had a sharp lift this week, up +2.21%. There is a sense of panic in this chart not seen in previous counter-trend rallies with big gaps up between daily candles. That is also shown in the Price Rate of Change Oscillator in the bottom panel. The ROC has been particularly sharp to the upside, not seen in previous counter-trend rallies. Something has changed in the psychology of Bond Traders this week. This could be the harbinger of better things to come in Bonds and Stocks. Too early to say just yet - but it is promising.
New Highs - New Lows Cumulative.
This is one of the important breadth indicators. Unless breadth is solidly positive, the market is always under threat.
NH-NL Cumulative continues to fall and is now well under its 10-Day Moving Average, that's a big red danger sign for long-term investors.
ASX Advance-Decline Line.
This is another important indicator of breadth.
ASX Advance-Decline Line is also bearish, and in sync with NH-NL Cum.
% of Stocks above key moving averages.
1. % of stocks above 10-Day Moving Average: Last Week 5%, This Week 50%.
2. % of stocks above 50-Day Moving Average, Last Week 3%, This Week 19%.
3. % of stocks above 200-Day Moving Average, Last Week 21%, This Week 19%
This week's bounce in the XJO is reflected in the above numbers with the shortest term metric (stocks above 10-DMA) moving from 5% to 50%.
The other two longer-term metrics remain in bearish territory - both at 19%.
I'd like to see all of these above 50% to feel comfortable about the longer term fortunes of the market.
Conclusion.
1. Monthly, Weekly and Daily Charts are all in sync - bearish. Any rebound should be a signal to sell into the rally. The XJO is currently in a short-term counter-trend rally.
2. Breadth remains poor. In the previous week, breadth figures were so bad contrarians took that as a chance to go long. How much longer it will last - we'll have to wait and see.
3. Bonds have spiked my interest this week. The sharp up-turn in Bonds suggests a sense of panic amongst Bond traders. Central Banks tend to lag the Bond market. Further rises in bonds will suggest that Central Banks will renege on their affirmations of many more interest rate rises. Too early to say, but worth watching.
3. We need to see a move up above 20 on the Stochastic Daily chart for short-term traders to go long.


