Friday, June 3, 2022

Finspiration Australia. Chart Analysis of Australian and International Stock Markets.

 4/6/22.  Yesterday in Australia.


XJO had a strong day, up +0.88% erasing the loss of the previous day.

The index remains in its upscoping Standard Error Channel and between horizontal support of 7106 and horizontal resistance of 7300.  Just above that is the 200-Day SMA at 7316.  XJO finished yesterday at 7239.  Dual resistance is usual difficult to overcome specially when one of those is the 200-DSMA.

Overnight in America.

The American market finished the week on a losing note.

Dow Jones -1.05%.  SP500 -1.63%.  Nasdaq -2.47%.  Small Caps -0.91%.  Banks -1.41%.

SP500.


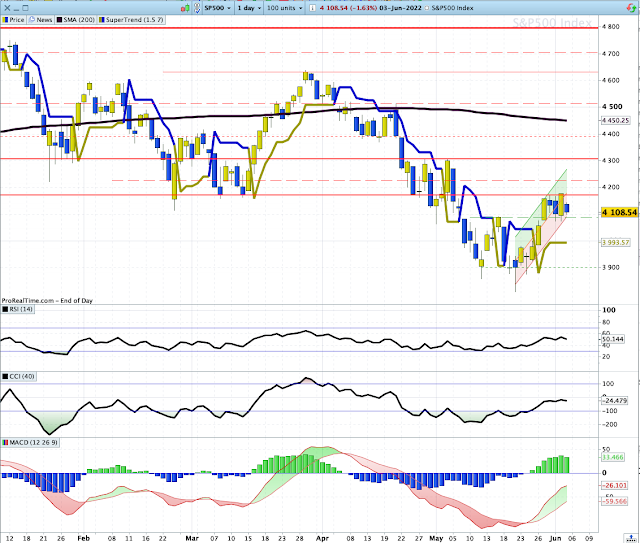
SP500 also remains in its up-sloping Standard Error Channel and consolidating in a tight range between 4089 and 4170.  SP500 finished at 4178.

The recent low was formed on 20/5/22.  The candle on that day had a long lower tail and looks to me like a Wyckoffian "Spring" which usually suggests the end of a major down-trend.  

Nothing ever goes in a straight line, so we can expect some to-and-froing with the next move to the down-side, shaking out some hopeful bulls before the next major move to the upside.  We shall see.

Commodities.

Commodities Index +0.95% was pushed up by Energy +1.94%.  Base Metals down heavily -1.95%.  Agriculture also down -0.95%.  Gold -1.02%

None of the overnight results looks promising for the Australian market on Monday.

New York Advances-Declines Line.


NY A-D Line is in an uptrend, coincident with the SP500.

It gave early warning of a change to the SPX downtrend with a positive divergence occurring 11-20 May while the SP500 was still down-trending.  Hopefully, it will give us a negative divergence before any change to a down-trend of the SP500.


Thursday, June 2, 2022

Finspiration Australia. Chart Analysis for Australian and International Stock Markets.

3/6/22.  Overnight.

U.S. Equities broke a two-day losing streak.


 Dow Jones +1.33%.  SP500 +1.84%.  Nasdaq +2.69%.  Small Caps +1.91%.  Banks +1.52%.

SP500.


SP500 is in a short-term up-trend and into a congestion zone from late-April/earlyMay.  Progress might be turgid now for a few days.  A test of the under-side of the Ichimoku Cloud is a possibility.

Commodities.


Commodities Index +2.28%.  Energy +2.23%.  Base Metals +4.19%.  Agriculture +0.5%.  Gold +1.23%.

Iron Ore +5.1%.  Thermal Coal +0.1%.

Overnight Oz Futures up +1%.  I wouldn't be surprised XJO does better than that given the overnight figures in equities and commodities.

Finspiration Australia. Chart Analysis for Australian and International Stock Markets.

 2/6/22.  XJO fell today -0.8%.


XJO remains in a short-term upsloping channel, which suggests the next move will be up.

If it remains in the channel, then a test of the all-important 200-DEMA is likely in the next few days.

Internals remain weak, with NewHighs-NewLows continuing to fall.


The current environment is not a positive one for long-term investors.

Wednesday, June 1, 2022

Finspiration Australia. Chart Analysis for Australian and International Stock Markets.

Overnight.


Dow Jones -0.54%.  SP500 -0.75%.   Nasdaq -0.72%.  Small Caps -0.33%.  Banks -1.97%.

SP500.

SP500 is consolidating at the top of a short-term up-trend.

The Index overall remains bearish.  Until we can see a decisive move above the Ichimoku Cloud.  Stay defensive.

Commodities.


Commodities Index +0.49%.  Energy +1.73%.  Base Metals -1.39%.  Agriculture -0.09%.  Gold +0.64%.

Iron Ore +0.2%.

The ASX has started well down at the opening, after 30 minutes it is down -1.1%.


Finspiration Australia. Chart Analysis of the Australian and International Stock Markets.

 1/6/22.  XJO up modestly after a choppy trading day.  Range was narrow.

The past three days has seen the XJO oscillator around the 200-Day MA.  That's considered an important marker between a bull and bear market.   

The XJO is indecisive.  It finished just below the 200 DMA.

Stand aside until we see a definitive break above the 200-Day MA.

Momentum is to the upside, so the odds are favourable for a decisive break above the 200-DMA.

Tuesday, May 31, 2022

Finspiration Australia. Chart Analysis of Australian and International Stock Markets

 1/6/22.  Overnight.

Major U.S. indices finish lower.  End of month book squaring resulted in high volumes.


Dow Jones -0.67%.  SP500 -0.63%.  Nasdaq -0.41%.  Small Caps -1.07%.  Banks +0.22%.

Positive economic news out of the U.S. resulted in rises in U.S. Treasuries - that was a negative for stocks.  Hawkish comments by Fed Governor Waller on future interest rate rises didn't help matters.  

SP500.    


SP500 is in a short-term up-trend, but longer term it remains bearish.  Until we see a decisive move above the cloud, this must still be considered a counter-trend rally.


Commodities.


Commodities Index -0.69%.  Energy +0.18%.  Base Metals -0.79%.  Agriculture -1.92%.  Gold -0.99%.

Overnight Oz Futures finished down -0.36%.  The ASX can expect a weak opening this morning.

Finspiration Australia. Chart Analysis of Australian and International Stock Markets.

31/5/22.  Last day of the month today and XJO fell -1.03% after being up yesterday +1.45%.  For the month of May, XJO was dow n -3.01%.  Seasonally, June tends to be flat.


The short-term trend remains up, but that looks increasingly in danger with resistance from the joint 50/200 DMAs just over head.

Tonight, trading returns to the U.S. after being closed for Memorial Day holiday.

Tomorrow, Australia sees release of GDP figures.  Those figures could be market changing.  A poor number could be good for the market, a good number could be bad for the market (because of effects on interest rates, one way or the other.)

Finspiration Australia. 14/11/23. Tues. Morning Report.

Mixed Results in New York.  Energy up. NAB ex-dividend today. Dow Jones +0.16%.  SP500 -0.08%.  Nasdaq -0.11%.  Small Caps -0.07%.  Banks -0...