Monday, April 18, 2022

Finspiration Australia. Objective technical analysis of Australian and International stock markets.

 19/4/22.  Overnight.  Little movement in U.S. equities.


Dow Jones -0.11%.  SP500 -0.02%.  Nasdaq -0.14%.  Small Caps -0.37%.  Banks +0.91%.

SP500.


Last night's candle was a narrow range, doji candle representing indecision.

SP500 remains in the Ichimoku Cloud - the no-trade zone.  Wait for a definitive movement in the index.

Commodities.


Commodities Index +1.14%.  Energy +1.05%.  Base Metals +1.31%.  Gold +0.31%.

Energy is now back to its old high from early March.  Last night's action looks like an exhaustion move: a gap up at the top of the trend, followed by some intra-day selling.  The next couple of days should confirm.

Iron Ore was flat.  0.0%.

After one hour of trading, the XJO is having a very positive day, up 42 points or +0.6%.  Resources (Energy and Miners are leading the way.

Saturday, April 16, 2022

Finspiration Australia. Objective Technical Analysis of the Australian and International Stock Markets

Weekly Wrap - Week ending 15 April, 2022.

XJO Monthly Chart.


March was a good month for the XJO, up +6.39%.   April has begun with a consolidation period, after two weeks it is up just +0.32%%.  8-Month EMA and Hull MA13 have both turned bullish.  It's early days in the month of April, so we need more time to see if this bullish bias can hold for the rest of the month.  At this stage, it is looking promising.

Weekly Chart.


XJO was positive this week, +0.61%. That maintains the medium-term bullish trend.
It remains above the 8-Week EMA, Supertrend (1.5/7) and  Hull Moving Average remain bullish.  Any pull-back is likely to be bought.

Daily Chart.


By the end of this week, XJO strengthened with the 8-Day EMA and Hull MA13 both turning short-term bullish.  The Supertrend (1.5/7) may be indicating a resistance level.

Using multiple time-frame analysis, Monthly and Weekly XJO remain bullish.  Daily XJO has also now turned bullish.  This is now a risk-on market.

Relative Strength of Sectors - past 52 days.


This chart compares the performance of each sector against the performance of the XJO.  Sectors above zero have outperformed the XJO over the past 52 days.  Sectors below zero have underperformed XJO over the past 52 days.  Eight Sectors were up this week and three down.  Gold (an Industry Group part of Materials) has had an exceptional week.

As a general rule, look for stocks in the best sectors and avoid stocks in the worst sectors.  For example, look to Utilities (XUJ), Energy (XEJ) and Materials (XMJ) for stocks to buy.  Avoid Consumer Discretionary (XDJ), Information Technology (XIJ) and Property (XPJ).  (Exceptions to that general rule could occur.)  XUJ is now very overbought and probably not a serious contender for current buying - look to buy the dip.


New Highs - New Lows Cumulative.

NH-NL Cumulative is in a consolidation phase and has just tipped under its 10-Day Moving Average, that's a caution sign for long-term investors.  Further deterioration should be taken seriously.


% of Stocks above key moving averages.

1.  % of stocks above 10-Day Moving Average, 52%.
2.  % of stocks above 50-Day Moving Average, 69%.
3.  % of stocks above 200-Day Moving Average, 56%.

All three are above 50% level - that confirms the risk-on status of the market.

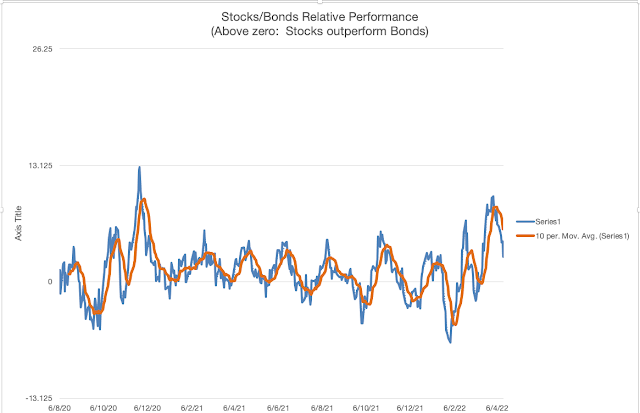
Bonds versus Stocks.


At the end of the week, Stocks had a clear advantage over Bonds.  

The relativity has weakened a little with the chart now below its 10-Day MA.  That's not necessarily a bearish signal - it's just that bonds are doing a little better in the past few days than they have in recent times.  Stocks are still the preferred option while the chart remains above zero.

Strong Stocks versus Weak Stocks.

Amongst the ASX100 stocks, I have 15 strong stocks and 10 weak stocks.  That still provides a bullish bias to the market.  But the number of weak stocks has steadily increased over the past four weeks.  Five weeks ago they stood at zero, now they are up to fifteen.  The market is becoming a little unbalanced, not dangerously - but we may be seeing some big internal shifts in the market.  

Eleven of the fifteen strong stocks came from Materials and Energy.  Add to that two from Utilities, which tends to correlate with Energy, we can see just how unbalanced the market is becoming.  A set-back for Materials and Energy could be a set back for the whole ASX.   Stay vigilant.

Conclusion.

 The monthly, weekly and daily charts remain positive and in sync.  While they remain in sync, we have a risk-on market.

Traders should concentrate on the strongest sectors:  Utilities, Materials and Energy.

Thursday, April 14, 2022

Finspiration Australia. Objective technical analysis of the Australian and International Stock Markets.

15/4/22.  Overnight.


 Dow Jones -0.33%.  SP500 -1.21%.  Nasdaq -2.14%.  Small Caps -0.68%.  Banks -1.36%.

Positive divergence on the Banks CCI suggests we'll see a counter-trend rally in that index in the near future.

SP500.


SP500 remains in a short-term down-trend, consolidating at the lower end of that trend beginning in early March.  That's almost long enough to call it a medium-term down-trend.

SPX continues to oscillate around the 50-Day MA and remains in the Ichimoku Cloud.  That's the no trading zone.  Wait.

Commodities.


Energy +1.75% continues to push higher under the influence of the Ukraine-Russia War.  That's pushing up the Commodities Index +0.75%.  Base Metals flat 0.00%.  Gold -0.33%.

NY Advances-Declines Line.


NYAD gives no indication of turning bullish.  Wait.

Wednesday, April 13, 2022

Finspiration Australia. Objective technical analysis of the Australian and International stock markets.

 14/4/22.  Overnight.


Dow Jones +1.01%.  SP500 +1.12%.  Nasdaq +2.03%.  Small Caps +1.66%.  Banks +0.15%.

Major indices moved higher after T-Note yields fell.

SP500.


Sp500 is oscillating around the 50-Day MA, but below the 200 Day Ma and remains in the Ichimoku Cloud.  The downtrend is still in play.  Wait.

Commodities.


Commodities Index +2.2%.  Energy +3.37%.  Base Metals +0.08%.  Gold +0.49%.

Iron Ore -1.4%.  Thermal coal continued to rise +0.9%.

Despite the fall in IO, RIO was up +1.8% in New York and BHP +1.43%.

Overnight Oz Futures up modestly +0.2%.  That's a disappointing gain after such good equities figures out of New York.

NY Advances-Declines Line.


NY A-D Line has broken its losing streak but remains below its 10-Day and 20-Day MAs.  It still has work to do to reclaim its bullish status.


Finspiration Australia. Objective technical analysis of the Australian and International stock markets.

 XJO up modestly today +0.34%.

The index saw upside buying in the afternoon, which added some respectability to the final result.

The last five days have seen the XJO in a consolidation pattern - losing interest before the long Easter weekend.

Most sectors were up today - the only negative was Property, down -0.5%, but two other sectors were flat, Information Technology and Telecommunications.  

The best performers were the resources with Energy up +0.6% and Materials up +0.6%.  Utilities close behind at 0.5%.

I can't see much happening tomorrow.

Thursday night (Oz time) U.S. reporting season sees some of the big banks reporting.  That could be market changing, but our market doesn't open until the following Tuesday.


Tuesday, April 12, 2022

Finspiration Australia. Objective technical analysis of the Australian and International stock markets.

 13/4/22.  Overnight.  U.S. equities lose ground again.


Dow Jones -0.26%.  SP500 -0.34%.  Nasdaq -0.3%.  Small Caps +0.55%.  Banks -1.36%.

SP500.


SP500 was down modestly last night and finished at about horizontal support from the high back in early March, 2022.  The index is sitting just below the 50-Day MA and the Ichimoku Base Line (Kijun Sen).  That's good support.

It is currently in the Ichimoku Cloud - the no-trade zone.  Continue to wait to see how this plays out.  Odds are pointing to an upside move - but the U.S. is coming up to some crucial reports particularly from the big U.S. banks.

Reporting season becomes something of a lottery - so anything could happen here.

Commodities.


Commodities Index +2.98%.  Energy +4.28%.  Base Metals +1.85%.  Gold +0.77%.

Iron Ore +1.7%.  Thermal Coal had a whoosh +6.3%.

Overnight Oz Futures were flat, down just three points.

Those good resource prices might give the XJO an upside edge today.


Finspiration Australia. Objective technical analysis of the Australian and International stock markets.

XJO down moderately today, -0.42%.


 XJO remains in a short-term down trend.  Hull MA13, EMA8 and Supertrend (1.5/7) are all bearish.

Wait until we get clear indication that this pull-back is over.

Finspiration Australia. 14/11/23. Tues. Morning Report.

Mixed Results in New York.  Energy up. NAB ex-dividend today. Dow Jones +0.16%.  SP500 -0.08%.  Nasdaq -0.11%.  Small Caps -0.07%.  Banks -0...