Wednesday, April 13, 2022

Finspiration Australia. Objective technical analysis of the Australian and International stock markets.

 14/4/22.  Overnight.


Dow Jones +1.01%.  SP500 +1.12%.  Nasdaq +2.03%.  Small Caps +1.66%.  Banks +0.15%.

Major indices moved higher after T-Note yields fell.
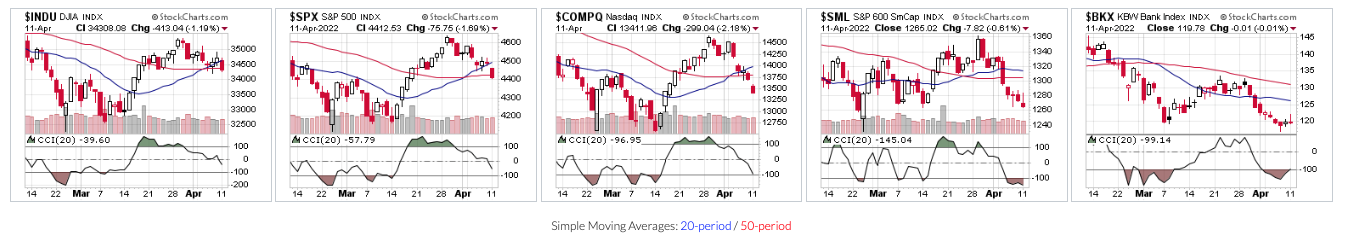
SP500.


Sp500 is oscillating around the 50-Day MA, but below the 200 Day Ma and remains in the Ichimoku Cloud.  The downtrend is still in play.  Wait.

Commodities.


Commodities Index +2.2%.  Energy +3.37%.  Base Metals +0.08%.  Gold +0.49%.

Iron Ore -1.4%.  Thermal coal continued to rise +0.9%.

Despite the fall in IO, RIO was up +1.8% in New York and BHP +1.43%.

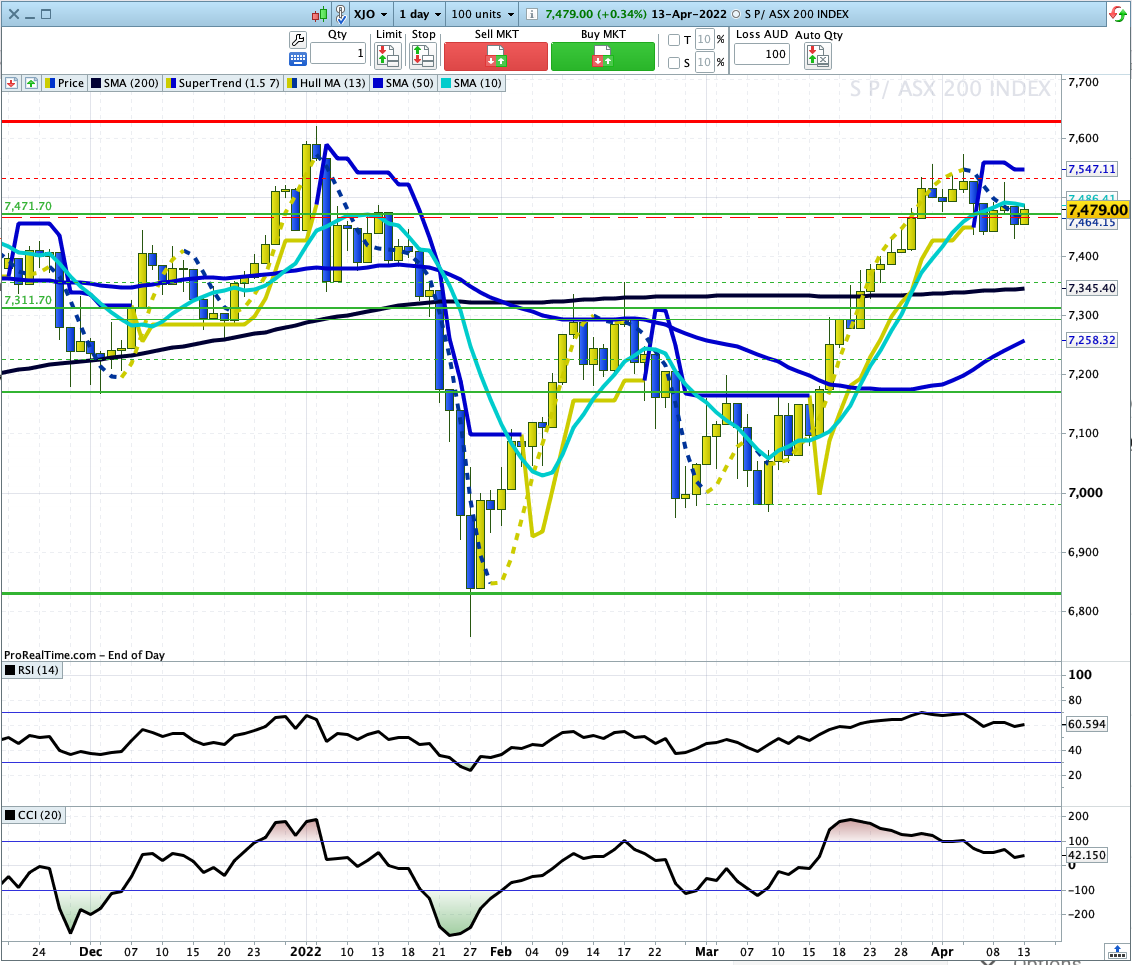
Overnight Oz Futures up modestly +0.2%.  That's a disappointing gain after such good equities figures out of New York.

NY Advances-Declines Line.


NY A-D Line has broken its losing streak but remains below its 10-Day and 20-Day MAs.  It still has work to do to reclaim its bullish status.


Finspiration Australia. Objective technical analysis of the Australian and International stock markets.

 XJO up modestly today +0.34%.

The index saw upside buying in the afternoon, which added some respectability to the final result.

The last five days have seen the XJO in a consolidation pattern - losing interest before the long Easter weekend.

Most sectors were up today - the only negative was Property, down -0.5%, but two other sectors were flat, Information Technology and Telecommunications.  

The best performers were the resources with Energy up +0.6% and Materials up +0.6%.  Utilities close behind at 0.5%.

I can't see much happening tomorrow.

Thursday night (Oz time) U.S. reporting season sees some of the big banks reporting.  That could be market changing, but our market doesn't open until the following Tuesday.


Tuesday, April 12, 2022

Finspiration Australia. Objective technical analysis of the Australian and International stock markets.

 13/4/22.  Overnight.  U.S. equities lose ground again.


Dow Jones -0.26%.  SP500 -0.34%.  Nasdaq -0.3%.  Small Caps +0.55%.  Banks -1.36%.

SP500.


SP500 was down modestly last night and finished at about horizontal support from the high back in early March, 2022.  The index is sitting just below the 50-Day MA and the Ichimoku Base Line (Kijun Sen).  That's good support.

It is currently in the Ichimoku Cloud - the no-trade zone.  Continue to wait to see how this plays out.  Odds are pointing to an upside move - but the U.S. is coming up to some crucial reports particularly from the big U.S. banks.

Reporting season becomes something of a lottery - so anything could happen here.

Commodities.


Commodities Index +2.98%.  Energy +4.28%.  Base Metals +1.85%.  Gold +0.77%.

Iron Ore +1.7%.  Thermal Coal had a whoosh +6.3%.

Overnight Oz Futures were flat, down just three points.

Those good resource prices might give the XJO an upside edge today.


Finspiration Australia. Objective technical analysis of the Australian and International stock markets.

XJO down moderately today, -0.42%.


 XJO remains in a short-term down trend.  Hull MA13, EMA8 and Supertrend (1.5/7) are all bearish.

Wait until we get clear indication that this pull-back is over.

Monday, April 11, 2022

Finspiration Australia. Objective technical analysis of the Australian and International stock markets.

 12/4/22.  Overnight, U.S. stocks fall.


Dow Jones -1.19%.  SP500 -1.69%.  Nasdaq -2.18%.  Small Caps -0.61%.  Banks -0.01%.

The bond market continues to wreak havoc in stocks.  10Yr T Note rose to a 3 1/4 year high at 2.79%.  That particularly hurts growth and tech stocks - not so much banks.

SP500.


Sp500 fell heavily overnight and below major supports of the 200 Day MA (black line) and the top of the Ichimoku Cloud.  It is now down to support of the 50-Day MA (blue line) and the Base Line (Kijun Sen) of the Ichimoku system.  It is also at horizontal support of the highs back in early March.

After such a big fall last night we could see upside tomorrow but not enough, probably, to offset the current bearish trend.  We'll need to see a couple of upside days to break the down trend.

Commodities.


Commodities Index -0.82%.  Energy -1.31%.  Base Metals -1.7%.  Gold +0.5%.

Iron Ore -1.5%

Australian Energy and Mining stocks will probably be under pressure today.

Overnight Oz Futures -0.4%.

Yesterday in Australia, the XJO suffered a reversal day which often suggests more downside.  Today looks certain to produce more downside - not a good scenario for the near-term future of our market.

Finspiration Australia. XJO finishes flat today. 11/4/22.

 XJO finished marginally up today +0.1% after being up +0.6% in early trading.  That's a disappointing result.

Today represents a reversal day.  That's bearish, but needs confirmation of a down day tomorrow.

Short-term, XJO is in a down-trend and finished today below the 8-Day EMA and the Hull MA13.

Two out of three Supertrends are blue - one remains yellow, which suggests in the medium term XJO is not trending.  A bearish break by the third Supertrend would give us a medium term sell signal.


Saturday, April 9, 2022

Finspiration Australia. Weekly Wrap, week ended 8/4/22

          XJO down this week.  

XJO Monthly Chart.


March was a good month for the XJO, up +6.39%.   April has begun with a consolidation period, down just -0.29%.  8-Month EMA and Hull MA13 have both turned bullish.  It's early days in the month of April, so we need more time to see if this bullish bias can hold for the rest of the month.

Weekly Chart.


XJO was negative this week, -0.21%. That's the first negative week after three weeks up in a row. 
The chart, however, is remains bullish.  It has moved above the 8-Week EMA, Supertrend (1.5/7)  Hull Moving Average remain bullish.  Any pull-back is likely to be bought.


Daily Chart.


This week, XJO weakened with the 8-Day EMA, Supertrend (1.5/17) and Hull MA13 all turning short-term bearish.

Using multiple time-frame analysis, Monthly and Weekly XJO remain bullish.  Daily XJO has turned bearish.  Wait for all three to be in sync before adding more money to this market.

Relative Strength of Sectors - past 52 days.


This chart compares the performance of each sector against the performance of the XJO.  Sectors above zero have outperformed the XJO over the past 52 days.  Sectors below zero have underperformed XJO over the past 52 days.

As a general rule, look for stocks in the best sectors and avoid stocks in the worst sectors.  For example, look to Utilities (XUJ), Energy (XEJ) and Materials (XMJ) for stocks to buy.  Avoid Consumer Discretionary (XDJ), Telecommunications (XTJ) and Health (XHJ).  (Exceptions to that general rule could occur.)  


New Highs - New Lows Cumulative.

NH-NL Cumulative this week returned to its 10-Day Moving Average, a break below would send a big caution signal to long-term investors.


Bonds versus Stocks.


At the end of the week, Stocks had a clear advantage over Bonds.  The relativity has weakened a little with the chart now below its 20-Day MA.  The chart is only a little below its recent high, which was the best its been since late November, 2020.  Extremes like this are often contrarian signals.  

Conclusion.

after three weeks of strong gains, the XJO pulled back a little this week, with the daily chart now short-term bearish.  The weekly and daily charts remain positive.  Wait for the three time scales to come back into sync.

Traders should concentrate on the strongest sectors:  Utilities, Materials and Energy.

Finspiration Australia. 14/11/23. Tues. Morning Report.

Mixed Results in New York.  Energy up. NAB ex-dividend today. Dow Jones +0.16%.  SP500 -0.08%.  Nasdaq -0.11%.  Small Caps -0.07%.  Banks -0...