XJO up modestly today +0.34%.
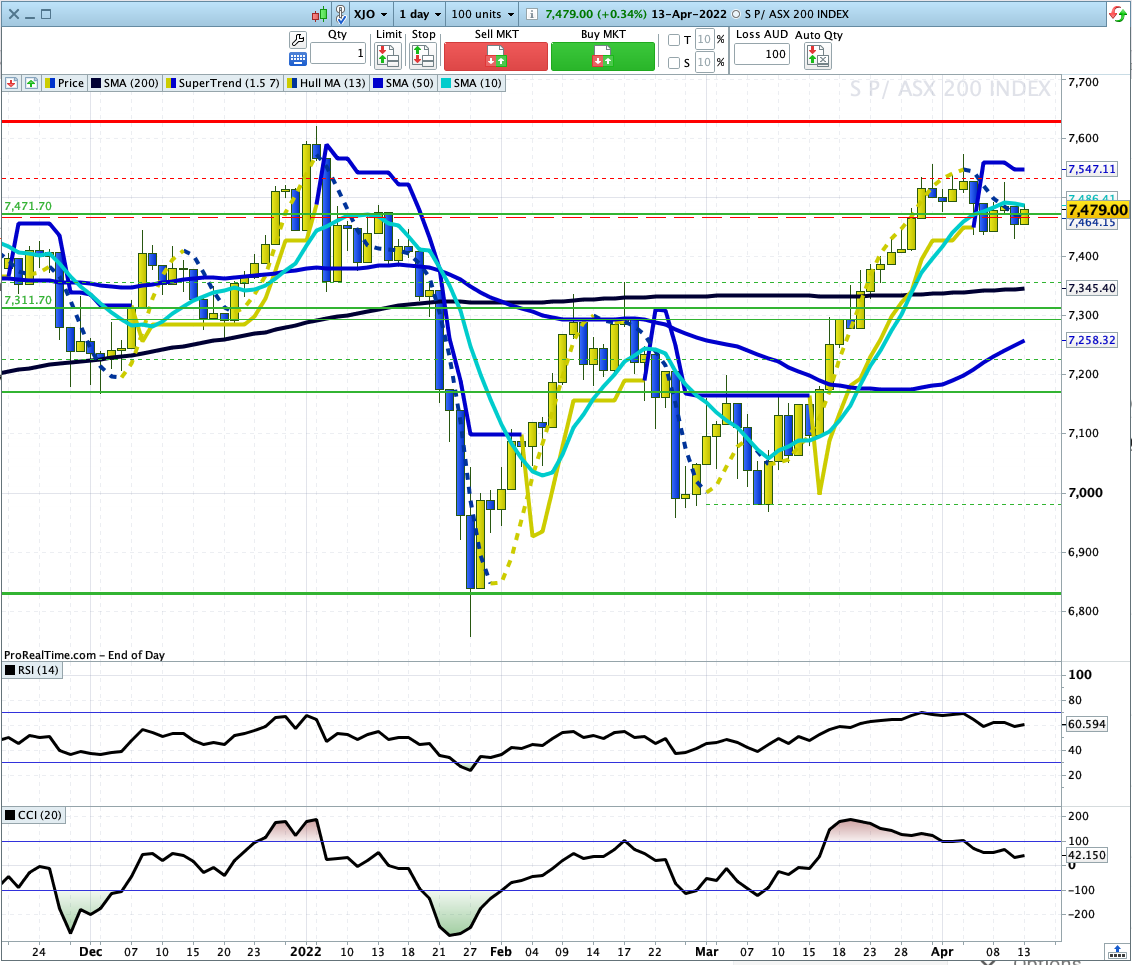
The last five days have seen the XJO in a consolidation pattern - losing interest before the long Easter weekend.
Most sectors were up today - the only negative was Property, down -0.5%, but two other sectors were flat, Information Technology and Telecommunications.
The best performers were the resources with Energy up +0.6% and Materials up +0.6%. Utilities close behind at 0.5%.
I can't see much happening tomorrow.
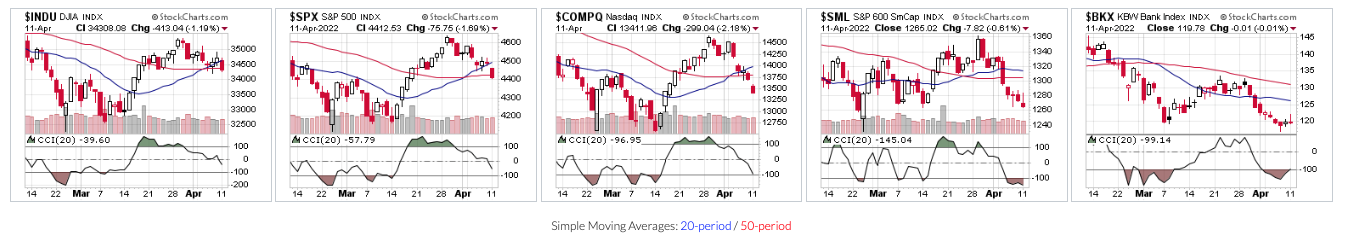
Thursday night (Oz time) U.S. reporting season sees some of the big banks reporting. That could be market changing, but our market doesn't open until the following Tuesday.