XJO down moderately today, -0.42%.

XJO remains in a short-term down trend. Hull MA13, EMA8 and Supertrend (1.5/7) are all bearish.
Wait until we get clear indication that this pull-back is over.
XJO down moderately today, -0.42%.
Wait until we get clear indication that this pull-back is over.
12/4/22. Overnight, U.S. stocks fall.
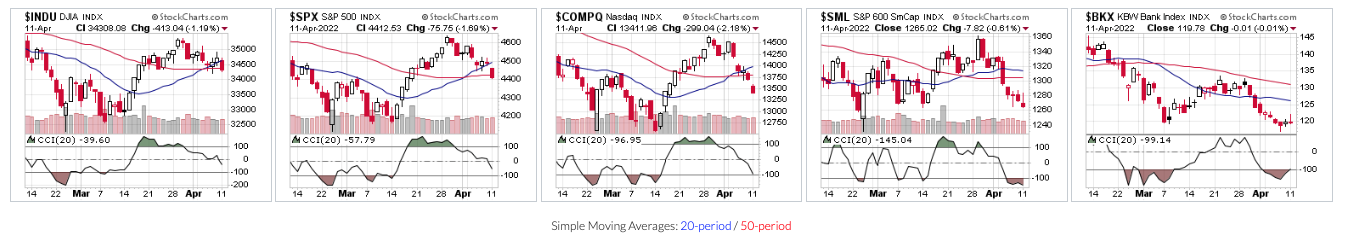
The bond market continues to wreak havoc in stocks. 10Yr T Note rose to a 3 1/4 year high at 2.79%. That particularly hurts growth and tech stocks - not so much banks.
SP500.

After such a big fall last night we could see upside tomorrow but not enough, probably, to offset the current bearish trend. We'll need to see a couple of upside days to break the down trend.
Commodities.

Iron Ore -1.5%
Australian Energy and Mining stocks will probably be under pressure today.
Overnight Oz Futures -0.4%.
Yesterday in Australia, the XJO suffered a reversal day which often suggests more downside. Today looks certain to produce more downside - not a good scenario for the near-term future of our market.
XJO finished marginally up today +0.1% after being up +0.6% in early trading. That's a disappointing result.

XJO down this week.
XJO Monthly Chart.

Weekly Chart.

Daily Chart.

This week, XJO weakened with the 8-Day EMA, Supertrend (1.5/17) and Hull MA13 all turning short-term bearish.
Using multiple time-frame analysis, Monthly and Weekly XJO remain bullish. Daily XJO has turned bearish. Wait for all three to be in sync before adding more money to this market.
Relative Strength of Sectors - past 52 days.


Bonds versus Stocks.

Conclusion.
after three weeks of strong gains, the XJO pulled back a little this week, with the daily chart now short-term bearish. The weekly and daily charts remain positive. Wait for the three time scales to come back into sync.
Traders should concentrate on the strongest sectors: Utilities, Materials and Energy.
XJO yesterday.

On Thursday, XJO fell below the first line of horizontal support and the 8-Day EMA, but Friday saw it climb back above both of those levels. This remains indecisive, another day to the upside is needed to confirm the end of the pull-back.
Overnight.

SP500.

The index sits precariously on the 200-Day MA which is often taken as the dividing line between a bearish and bullish market.
This could go either way. Wait.
Commodities.

Those commodity prices are positive for our energy and mining stocks on Monday.
NY ADVANCES-DECLINES LINE.

Overnight.

Indices were well down in early after-noon trading, but markets rebound to erase early losses.
SP500.

We need to see further upside to presume the pull-back is over.
Commodities.

Iron Ore -2.1%. Thermal Coal -1.7%.
Overnight Oz Futures +0.5%.
XJO should have a better day today, but those metals prices might put a cap on the miners.
XJO down today -0.63%.

Mixed Results in New York. Energy up. NAB ex-dividend today. Dow Jones +0.16%. SP500 -0.08%. Nasdaq -0.11%. Small Caps -0.07%. Banks -0...
