Wednesday, February 9, 2022

Finspiration Australia. U.S. T-Note yields fall boosting stock returns

Overnight. 


Dow Jones +0.86%.  SP500 +1.45%.  Nasdaq +2.08%.  Small Caps +1.12%.  Banks +0.09%.

SP500.


SP500 has broken upwards from its short-term consolidation.  It remains locked between the 50-Day MA and the 200-Day MA.  The chart also remains below the Ichimoku Cloud.  This remains, in my view, a counter-trend rally.  Wait.

Commodities.


 Commodities Index +1.01%.  Energy +0.56%.  Base Metals +2.76%.  Gold +0.34%.

Iron ore down -2.1%.

After 10 minutes of trading, the XJO is up +0.6%.

NAB reported this morning and is going gang-busters, up +3.49%, that will further boost the price of the other banks.

Finspiration Australia. Oz stocks finish strongly on the back of corporate reports.

 XJO up today +1.14%.  The morning session was volatile with the market rising stronger then falling back almost to par at 11.40 a.m.  From then on it was all upside.


XJO continues its strong counter-trend rally.  Now facing crucial resistance with 50-Day and 200-Day Moving Averages just overhead.

If we keep getting good corporate reports, XJO could continue to the upside.

Today, Commonwealth Bank lead the band with a +5.58% move after announcing good results.

Tomorrow we get ASX, Mirvac, Cimic, Downer EDI, AMP and AGL.  None of those have the same weight as CBA, but all are in the ASX100.


Tuesday, February 8, 2022

Finspiration Australia. Good corporate earnings push up U.S. stocks

 Overnight:


Dow Jones +1.06%.  SP500 +0.84%.  Nasdaq +1.28%.  Small Caps +1.78%.  Banks +2.03%.

SP500.


 SP500 continues with its sideways consolidation.  Wait.

Commodities.


Commodities Index -0.87%.  Energy -1.51%.  Base Metals +0.13%.  Gold +0.31%.

Iron Ore +0.4%.

CBA reported this morning.  The market likes the report, CBA up +5%.

After 30 minutes of trading, XJO up +0.6%.  Sectors are mixed this morning with more negatives than positives, but the market is buoyed by Financials, up +1.84%.

Finspiration Australia. XJO finishes higher despite poor lead from U.S.

 XJO was up +1.07% today.  The index peaked at 12.00 then chopped sideways to the end of trading, finishes close to the high of the day.


XJO is now at a major test point.  It is sitting at the 20-Day MA and the Kijun-Sen.  Expect a pause here.

Overall pressures remain to the downside, despite the recent counter-trend rally.  50-Day MA is below the 200-Day MA and the Index is below the Ichimoku Cloud.

The Australian market is into reporting season, and a lot of results today supported the market.  Macquarie Group (MQG) up +3.9%.  Suncorp (SUN) up +5.5%.  SCP Property (SCP) up +3.21%.

The two biggest sectors in the market both did well today, XMJ up +2.2% and XXJ +1.4%.

Despite the above good results, NewHighs-NewLows was negative -4.  Australian VIX also went across the grain, rising +0.94% to 15.67.  

In Europe, Germany's DAX is up +0.6% and U.K. FTSE is up +0.6%.  Let's see where they end.

Monday, February 7, 2022

Finspiration Australia. U.S. Stock indices mostly lower.

 Overnight:


Dow Jones flat 0.00%.  SP500 -0.37%.  Nasdaq -0.58%.  Small Caps +0.1%.  Banks +0.62%.

SP500.

Monday's candle was a narrow-range, inside-day candle indicating indecision.  The past three days have straddled the 8-Day EMA, another sign of indecision.

Major moving averages also provide little direction - SP500 is above the 200-Day MA but below the 50-Day MA.

Monday's finish ended below the short-term line and the medium-term line which suggests down-ward pressure on the Index.

Seventh-tenth days of the month are often bearish.  Wait.

Commodities.


Commodities Index +0.22%.  Energy -0.35%.  Base Metals +0.56%.  Gold +0.74%.

Iron Ore.  China was back from holidays.  IO up +1.9%.

Oz overnight Futures down -0.2%.

Yesterday reporting season in Australia started in earnest.  Major news came from ANZ, which initially fell more than -5% but finished down -1.92%.  Today we get Suncorp (SUN) and Shopping Centres Australia (SCP).  Tomorrow is another big bank, CBA which is likely to be market moving.


Finspiration Australia. XJO drops -1% then reverses.

 XJO finished down marginally today -0.13%.


Strong intra-day buying erased early losses of about -1%.  That's promising.  But XJO faces a lot of overhead resistance in the near future.

Breadth today was more or less in line with the marginal change in the XJO

Cumulative NewHighs-NewLows fell a little and remains below its 10-Day MA.


This is close to an upside break-out, but, until that happens, let's wait.


Saturday, February 5, 2022

Finspiration Australia. Weekly Wrap, week ended 4/2/22

  XJO has strengthened in the short-term.  Bearish conditions remain.
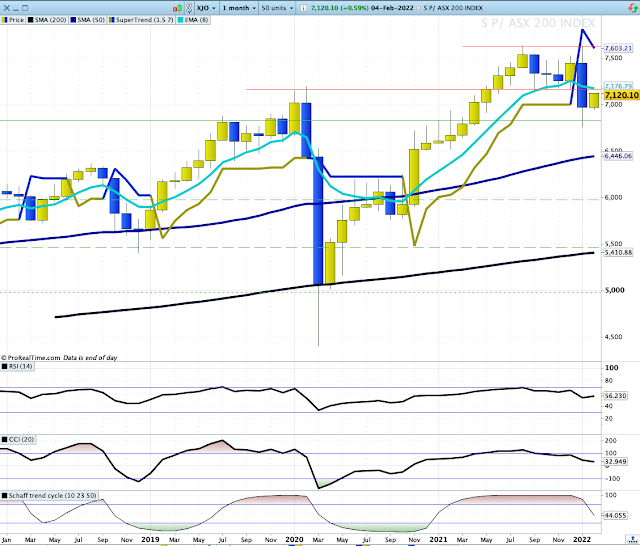
XJO Monthly Chart.


In January, the monthly chart showed a sell signal for both the Supertrend (1.5/7) and the 8-Month EMA.

Despite a good result in the first week of February, the XJO monthly chart remains below both the 8-Month EMA and the Supertrend.
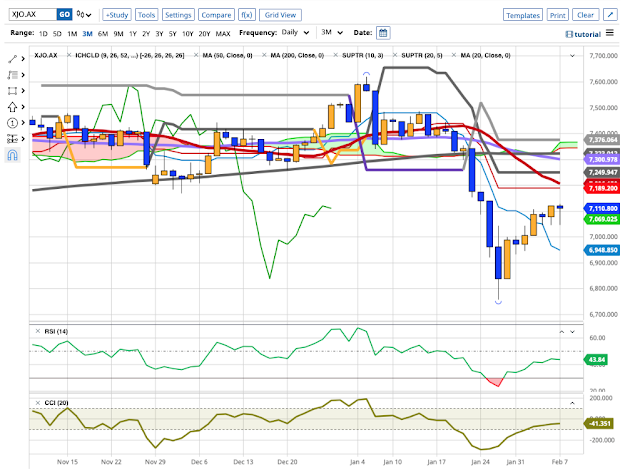
Weekly Chart.


XJO up this week +1.89%.

XJO has  rebounded from a major support level set back in March, 2020.  

It now faces a major resistance level.  It remains below both the 8-Week MA and Supertrend (1.5/7).

Such a long-term support/resistance level has a lot of strength and will be difficult for the XJO to break above.  If it does - XJO is then back into its old long-term trading range - lots of sideways action can be expected if that happens.

So - XJO is now locked between two major support/resistance areas.  The most likely scenario will be for the XJO to test resistance at 7168 and then fall again.  XJO is currently at 7120.

Daily Chart.


In the short-term, XJO is doing well.  A strong week has taken the XJO back above its 8-Day EMA and given a buy signal by crossing above its Supertrend (1.5/7).

But, there are plenty of cautions lie in this chart.  Just overhead is a major resistance level.  Above that we have a "death cross", where the 50-Day MA has crossed below the 200-Day MA.

The "death cross" predicted major bear markets in 1929, 1938, 1974 and 2008.  It is not, however, always reliable.  A "death cross" occurred in March, 2020 - which failed as a predictor with the market rebounded strongly into a bull market which has only recently ended.  Take it for what it's worth - another warning sign.

We now have the short-term trend rising, with longer term trends still bearish.  The current short-term trend could be the start of something bigger, or it could be a counter-trend rally which will fail.  Still - time to be cautious about plunging money into this market.  More information about this further on in this report

Sector changes this week.


All eleven sectors were up this week, with the best performer Energy (XEJ +4.93%).  The increase in XEJ also dragged up Utilities (XUJ +4.4%).  The two worst performers (relatively) were Financials (XXJ +0.99%) and Consumer Staples (XSJ +0.97).

The market saw some interesting divergences in the four big banks, which usually perform more or less alike.  Westpac was up +4.31% after advising the market about some cost-cutting measures.  NAB was up +0.94%.  ANZ down -1.38%.  CBA down -1.64%.  WBC seems to be the place to be.

New Highs - New Lows Cumulative.


NH-NL Cumulative remains decisively below its 10-Day Moving Average.  Until it breaks back above its 10-Day MA, this indicator suggests that long-term investors remain defensive.


The bearish reading on the NH-NL Cum is confirmed by Strong-Weak Stocks Chart which moved up a little this week but remains below its 5-Week MA.   

Bonds versus Stocks.


The Stocks/Bonds Ratio chart moved up this week, but remains well below the zero line.  We need to see this ratio above zero to prefer stocks over bonds.  

This doesn't necessarily mean an either/or situation.  But does help in deciding allocations between stocks and bonds for long-term diversified investors.

Stocks above key moving averages - last week and this week

A look at the number of stocks in the ASX100 above key moving averages provides an idea of how bad thins are.

ASX100 stocks above 10-Day MA:  Last week - 6%.  This week - 69%.

ASX100 stocks above 50-Day MA: Last week -  20%.  This week - 33%.

ASX100 stocks above the 200-Day MA: Last week - 32%.  This week - 40%.

Until we get all figures above the 50% mark, we'll assume that we are looking at a counter-trend rally

Conclusion.

We had a strong counter-trend rally this week.  It could be the start of something bigger but we need to see more evidence before concluding that we are back in bull market conditions.

Stay safe.  Good trading

Finspiration Australia. 14/11/23. Tues. Morning Report.

Mixed Results in New York.  Energy up. NAB ex-dividend today. Dow Jones +0.16%.  SP500 -0.08%.  Nasdaq -0.11%.  Small Caps -0.07%.  Banks -0...