Monday, January 17, 2022

Finspiration Australia. Objective analysis of the Australian and overseas stockmarkets.

 Tue. a.m. 18/1/22.  Europe up, U.S. closed.

Overnight.

The U.S. stock and bond markets were closed for MLK Holiday.  Europe rose.  German DAX was up +0.3% while UK FTSE was up strongly +0.9%.  European Stoxx600 rose +0.7%.  Toronto Composite was up +0.8%.  Canada, like Australia, has a strong resources segment, but the composition is different from Australia's.  While Australia is skewed to iron ore, Canada is skewed to energy.  The Toronto index has a degree of correlation with Australia, but it is not strong.

Commodities.

Oil prices were generally higher last night.  U.S. Nymex was up +0.6%.  Copper up modestly +0.2%.  Gold up +0.1%.  Iron Ore fell -2.2%.  That is likely to impact the prices today for RIO and FMG, the two big miners most dependent on Iron Ore.  BHP is more diversified.  BHP up in the U.K. +1.4%.

All of the above suggests a modest positive opening for the XJO.  At 10.06 a.m. Eastern Summer Time, XJO was up just 3.2 points up - not enough to move the %age indicator.


Finspiration Australia. Analysis of the Australian and Overseas Market

 Mon. p.m. 17/1/22.  XJO remains delicately balanced.

XJO finished up today +0.32%.


There was some rotation out of the best performing sectors into the weaker sectors today.  Materials (XMJ -1%) saw transitions into recently weak sectors.  Consumer Discretion (XDJ +2.2%) was the best performing sector today.  A positive report from Wesfarmers helped that sector, WES +2.6%.  Consumer Staples (XSJ +0.9%) also benefitted from the rotation.  Woolworths (WOW +1.3%) was a major beneficiary.

Stocks/Bonds relativities continue to favour stocks over bonds.


Not much can be read into today's action.  XJO remains within a tight sideways short-term trend.  Watch one way or the other for a break outside that range.

Stock and Bond markets are closed in America tonight (our time) for the MLK Memorial Holiday.

Our market usually trades in desultatory fashion ahead of such holidays.  And that's what we saw today.


Saturday, January 15, 2022

Finspiration Australia. Analysis of the Australian and overseas markets.

     Weekly Wrap, Week ended 14/1/22.  Ozzie market back into old trading range.

(Note:  Much of today's chart analysis uses terms from the Japanese Ichimoku trend following system.  If you are unfamiliar with Ichimoku, you can find good explanations here and here.)

XJO Monthly Chart:


XJO has had a great bullish trend since the end of the 2020 Covid bear market.  XJO topped in August, 2021 and has since stalled.  January has seen a test of the August, 2021 high and has now retreated.

On this monthly chart, XJO remains above the Tenkan Sen - pale blue line. (mid-point of the past nine candles).  A close below the Tenkan Sen on the monthly chart would be bearish.

Waiting for a monthly close may be too late to save precious dollars from a big fall.  We need to be looking at the Weekly and Daily charts.

XJO Weekly Chart:


On this weekly chart of the XJO, I've marked out the trading range for the Index which stretches  back to early September.  

The Santa Rally broke upwards from the trading range but has since failed and the XJO is now back inside the trading range.

The Tenkan Sen (mid-point of the past nine candles) and the Kijun Sen (mid-point of the past 26 candles) are now coincident - that's indicative of a non-trend market.

There are positives in this chart which suggest we will see a break to the upside.  From the low in early December, the XJO has had a series of higher highs and higher lows - definition of an up-trend.  Ignoring the false break of the Santa Rally, this appears to be making a right-angled triangle formation - which usually breaks to the upside.  A break above the August high would be very bullish.

The weekly XJO Chart shows a fall this week of  -0.8%.  (Remember last week, my headline read "Danger, Will Robinson, Danger).

The top restraining line of the trading range is at 7470.  A break above that should see another test of the old August, 2021 high.

A break through the bottom of the trading range would be bearish.  I'm not expecting that in the coming week.
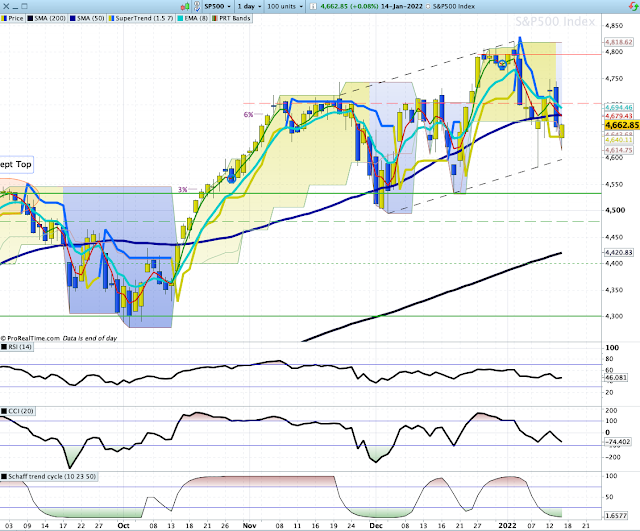
Daily XJO chart:


In the short-term, The XJO is delicately poised between some important support and resistance levels.

Overhead Resistance comes in the form of a major horizontal resistance level and the Tenkan Sen (mid-point of the past nine candles).

Support comes from the 50-Day Moving Average and the oblique support line - the dashed black line on the chart.

Those support and resistance levels are fairly close together.  A break one way or the other should determine short-term direction of the Index.

One Week Sector Changes:


This week saw three sectors up and eight sectors down.  Breadth was even more unbalanced than the previous week when we had four sectors up and seven down.  Unbalanced markets often lead to more falls to the downside.  The market is currently heavily skewed to the resources sectors (Materials +4.67% and Energy +4.1%).  If they start to fail, without improvement in sectors such as Financials, we could get a quick slide to the downside.

Omicron is obviously having a big effect on sectors skewed to the domestic market.  Consumer Staples (XSJ) was the worst performing sector, down -5.54%.  The big supermarkets (Woolworths -6.29% and Coles-5.71%) are suffering from supply chain shortages caused largely by Omicron.  The same effect can be seen in Consumer Discretionary (XDJ), down -4.53%.  XDJ includes such stocks as Wesfarmers down -7.63% for the week, Domino's Pizza down -10.55%

Information Technology (XIJ) was the second biggest loser, down -4.64%.  XIJ is being affected by the other big negative we're seeing for the market, i.e., rising interest rates, as Reserve Banks attempt to throttle inflation.   Information Technology stocks tend to be heavily leveraged growth stocks, so any increase in interest rates has a negative effect.

The best two performing sectors were Energy (XEJ) +4.27%% and Materials (XMJ) +2.29%.  Those two sectors are the two resource sectors - they tend to benefit from rises in inflation.  Utilities (XUJ continues its recent good performance, up this week +3.57%, another sector to benefit from inflation.  

We have two key themes in the market this week:  Omicron and Inflation


NewHighs-NewLows Cumulative.

For long-term investors, this is one of the most important charts to watch.


The Cum NH-NL is now sitting above its 10-Day Moving Average after a flattening out for a couple of weeks.  The chart provides assurance for now for the long-term investor.


The Strong-Weak Stocks Chart dipped a little this week but remains above its Moving Average, providing a confirmation of the Cum NH-NL.  

The stats for this week were:  Strong Stocks +13, Weak Stocks +17,  on balance ST-WS = -4.  

10 out of 13 of the Strong Stocks were miners or energy producers.  That's another indication of how unbalanced the XJO has become.  Weak Stocks were more evenly spread across sectors.

An unbalanced market often leads to the downside.


Conclusion: This week, the XJO dropped back into its trading range.  It is delicately poised between supports and resistances.  

I'm expecting the XJO to be up on Monday but not enough to force a break of those near-by Support/Resistance areas.  Tuesday/Wednesday may prove crucial for the XJO.

Measures of breadth have shown evidence of unbalancing - often a sign of a down move.

The long-term trend remains to the upside.  The medium-term trend remains sideways.  Wait to see how this breaks before making new investment/trading decisions.


Friday, January 14, 2022

Finspiration Australia. Market Analysis of Australian and Overseas Markets.

 Sat. 15/1/22.  Oz down, U.S. Mixed.

Yesterday in Australia.


XJO was down heavily -1.08%.  The short-term trend is down, but lies in an upsloping channel.  It is currently testing support of the lower supporting line of the channel and the 50-Day Moving Average.  That suggests hat the next move will be to the upside, but, until horizontal resistance at 7471 is broken to the upside, it is best to remain cautious.

Since early September, XJO has basically traded sideways in a broad range with a false break to the upside produced by the Santa Rally.  That's a long time for a sideways trend and frustrating for medium to long-term traders.  This type of cautious markets occurs from time to time, but this has been a particularly long period of sideways action.  See tomorrow's Weekly Wrap for more on this.

Overnight in the U.S.


Dow Jones -0.56%.  SP500 flat +0.08%.  Nasdaq +0.59%.  Small Caps +0.45%.  Banks -0.31%.

Although the U.S. results are mixed, intra-day trading was consistent with strong buying coming into the market in the afternoon session.  That's usually a sign that institutions are buying - and confident that further upside will be seen.

SP500.


The short-term trend is to the down-side, but, like the Oz market, SP500 is in a medium-term up-sloping channel.  It is currently close to the lower supporting line of that channel.  There could be a bit more downside in this but probably not much, with the potential of a double bottom forming.  Next move will probably be to the upside.

The intra-day buying last night can be seen in the current candle, with a long lower wick topped by a yellow body.  That means that the SP500 opened lower, then fell, followed by strong intra-day buying which took the Index well above its opening price.  That's a positive.  We need to see follow-through buying in the next day to confirm.

Commodities.


Commodities Index +1.3%.  Energy +2.05%.  Base Metals -0.22%.  Gold -0.29%.

U.S. Banks.

The U.S. Bank Index has been tearing high (see above $bkx) for the past month.  Three big banks reported last night and would have needed outstanding results to continue the push higher.  The negative divergence on the CCI once again proved to be a leading indicator, and BKX fell last night -0.31%.  

It wasn't all bad news.  Wells Fargo rose +3.7% last might, but JP Morgan fell more than -6% and Citigroup down -1.3%.  Morgan Stanley and Goldman Sachs report next week.

Conclusion.

As indicated above, I'm expecting are market to be up on Monday, but no change in the technical picture.

Thursday, January 13, 2022

Finspiration Australia

 Fri. a.m. 14/1/22.  Nasdaq suffers big fall.

Overnight.


Dow Jones -0.49%.  SP500 -1.42%.  Nasdaq -2.51%.  Small Caps +0.01%.  Banks +0.19%.

SP500.


SP500 has retreated from resistance.  The three-day candle-stick pattern (up, doji, down) is bearish in the short-term, but the Index remains above the "cloud" so any pull-back is likely to be short-term.

Commodities.


Commodities Index -1.06%.  Energy -1.14%.  Base Metals -0.22%.  Gold -0.34%.

Iron Ore -2.8%.

Yesterday, all the stars were aligned positively for the XJO.  Today the alignment is negative.

Expect a negative day on our market today - and a retreat from overhead resistance mentioned in last night's report.


Finspiration Australia

 Thu. p.m. 13/1/22.  XJO finished higher today.

XJO was moderately higher today +0.48%, but off the highs which occurred at 1.45 p.m.

XJO has finished at horizontal resistance which stopped advances from October to early December.

The Santa Rally produced a break above resistance, but that proved to be a false break after the big down day on 6 January, when the XJO fell a mammoth -2.74%.

XJO is still struggling to get above horizontal resistance.  Interestingly, today finished its high at 1.45 p.m. which coincided with R1 of today's Pivot Points.

So today we add a double whammy resistance level - long term stretching back to October and intra-day.  That's a powerful combination.  No wonder XJO fell a little in the afternoon trading.

Breadth today was good but not spectacular.  Advances 764 Declines 698.  New Highs clocked in at 47, New Lows 7.

The Cumulative NewHighs-NewLows is an important metric for long-term investors.  


 While Cum NH-NL stays above its 10-Day Moving Average, long-term investors can sleep easy.

Cum NH-NL had a shaky sideways movement in November to early December, but it has shaken off that scare.  Cum NH-NL has kept long-term investors in this market since May 2020, although that shaky period a few weeks ago was a scare - the worst one in over 18 months.

We're still long in the long-term for this market.


Wednesday, January 12, 2022

Finspiration Australia

 Thur. a.m. 13/1/22.  Choppy trading in the U.S. produces modest rises in indices.

Overnight:


Dow Jones +0.11%.  SP500 +0.28%.  Nasdaq +0.23%.  Small Caps -0.46%.  Banks +0.51%.

The negative result in Small Caps suggests that breadth was weak.  

The strong up trend in Banks could end soon as momentum measured by CCI shows a negative divergence.

SP500


With the 50-Day MA (curving blue line) heading upwards, the bias in the SP500 is to the upside.

The PRT bands (yellow) remain bullish.

The choppy nature of last night's trading can be seen in the current doji candlestick.  The small body shows that the Index had little change from opening to closing, while the long upper and lower wicks indicate how trading oscillated above and below the opening price.  Such candlesticks denote indecision.

The U.S. market is entering into reporting season, with some major airlines and banks reporting later in the week.  Delta Airlines on Thursday.  Citigroup, J.P. Morgan Chase and Wells Fargo on Friday.  Those results could be market moving. 

Commodities:


Commodities Index +0.79%.  Energy +1.37%.  Base Metals +0.26%.  Gold +0.26%.

Iron Ore +2.3%.

Overnight results look mildly positive for our market today, but overnight Sydney Futures were down marginally, just 3 points.  So we should have a flat opening today.  Our market was relatively strong yesterday - don't expect much today. 


Finspiration Australia. 14/11/23. Tues. Morning Report.

Mixed Results in New York.  Energy up. NAB ex-dividend today. Dow Jones +0.16%.  SP500 -0.08%.  Nasdaq -0.11%.  Small Caps -0.07%.  Banks -0...