Tuesday, January 4, 2022

Finspiration Australia

 Wed. a.m. 5/1/22.  Mixed results in U.S.

Dow - new record.  SP500 flat.  Nasdaq down.  Banks Whooshka.  Bond yields higher.


Dow Jones +0.59%.  SP500 -0.06%.  Nasdaq -1.33%.  Small Caps +0.65%.  Banks 3.39%.

US 20Yr Treasuries Yield +5.67%.  That's what sank the Nasdaq which is sensitive to interest rates - and gave the Banks such a boost.

SP500.


SP500 is in a short-term sideways consolidation.  The medium-term trend remains up.

Hull 13MA has turned down which suggests the next move will be to the downside.  Plenty of support remains on the downside, so this may be a buy the dip scenario.

Commodities.


Commodities Index +1.2%.  Energy +1.09%.  Base Metals +1.36%.  Gold +0.74%. 

Iron Ore +2.8%.

Overnight Oz Futures -0.3%.

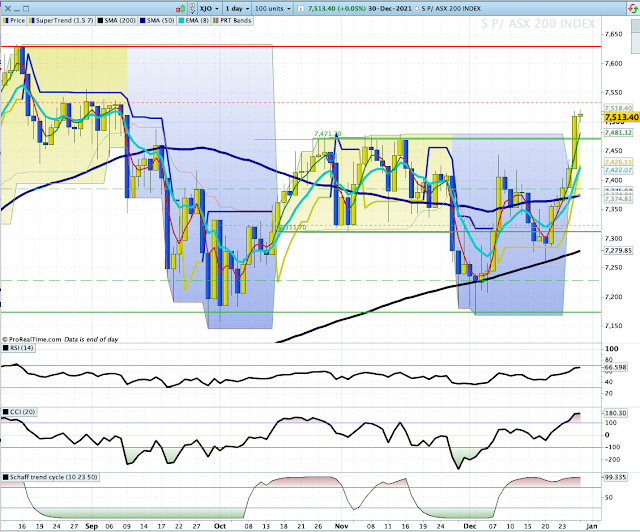
Expect a weak opening after yesterday's huge rise in the XJO.

 Tue. p.m. 4/1/22.  XJO - Whooshka.

XJO was up today an extraordinary +2%, so it definitely deserves a "Whoosha" label.  We rarely see +2% rises on the XJO, but it happened today on the first day of trading 2022.


 Clearly, today was an extraordinary event, helped by low volumes, it is easy to push the index around.

Technically, I've marked in grey a major support zone, so it wasn't unpredictable that we would see an up move today, but the sheer scale of the up move is extra-ordinary. 

Expect some downside tomorrow.

Monday, January 3, 2022

 Tue. a.m. 4/1/22.  New closing high for the Dow.

Overnight.


Dow Jones +0.68%.  SP500 +0.64%.  Nasdaq +1.2%.  Small Caps +1.08%.  Banks +2.62%.

SP500.


The trend remains up.  Stay with the trend.

Statistically, the Santa Rally has one more day to run.  Keep watching the charts for a reversal.

Commodities.


Commodities Index +0.38%.  Energy +1.64%.  Base Metals -0.81%.  Gold -1.54%.

Iron Ore +0.4%.

After 20 minutes of trading, XJO is up +0.8%.

Sunday, January 2, 2022

 Yearly wrap-up.  Year ended 31/12/21.

It's that time when we look in the rear-view mirror and see how the Ozzie market did in 2021.  Not too bad actually, not fantastic, but good enough to make most investors happy.


The above chart shows the yearly performance of the XJO over the past 21 years.  In those 21 years, 2021 was the eighth best yearly performance.  That puts it in the top half of performances.  

XJO up in 2021 by +13.02%.  The average yearly gain in the past 21 years a little over +5%.  That figure, of course, has been skewed by the big drop in 2008 when the XJO was down more than -40%.

The median figure for the XJO for the past 21 years is 7.9%.

Dividends for the XJO in 2021 were +3.78%.  So, total return in 2021 was 16.8%.

The XJO Index was launched in the year 2000.  Before then, the Australian All Ordinaries was the benchmark for investments in Australia.  Since 1900, the average total return for the Australian market has been 11.8%.

So - if an investor had put their money into the XJO at the beginning of 2021, they would be feeling good about their investment.  

Historical returns since 1900:

For more market statistics go here:

What does it all mean for 2022?  Nothing at all.  2022 could do anything.

Keep an eye on the monthly chart of the XJO if you want to take defensive action as a result of a down turn:


Supertrend 1.5/7 and 8-Monthly Exponential Moving Average usually provide timely warnings for exits and entrances.  They won't give you tops and bottoms - but they do provide a good safety net.

All the best for 2022.


Friday, December 31, 2021

 Sat. 1/1/22.  XJO down heavily, U.S. falls in last 30 minutes.

Yesterday in Australia.


XJO down -0.92% and below major horizontal support level.

PRT Bands continue to indicate a bullish trend.  The 8-Day EMA could provide support.

Looking under the bonnet, some surprises can be seen.  NewHigs-NewLows, for example, came in at +41, which remains bullish.

Overnight in America.


 Dow Jones -0.16%.  SP500 -0.26%.  Nasdaq -0.61%.  Small Caps -0.04%.  Banks -0.06%.

SP500.


This looks like topping action but the short-term trend remains up.  Until it breaks below the 8-Day EMA, stay with the trend.

Commodities.


Commodities Index -0.48%.  Energy -1.39%.  Base Metals +1%.  Gold +0.68%.

Australian market is closed on Monday for New Year's Day holiday.  America will trade on Monday night (our time), so we'll have more American data to digest before we re-open on Tuesday.

Judging by the big fall in Oz yesterday, we can expect consolidation - but new data out of America could change that.

Thursday, December 30, 2021

 Fri. a.m. 31/12/21.  U.S. stocks fall in last half-hour of trading.

Overnight.


Dow Jones -0.25%.  SP500 -0.3%.  Nasdaq -0.16%.  Small Caps -0.46%.  Banks -0.35%.

SP500.


SP500 set a new intra-day high record, but late selling pushed it into negative territory.  This looks like the start of a pull-back, but with plenty of nearby support, the dip will probably be bought.

Commodities.


Commodities Index (-0.45%) is following a similar path to stock indices.  Energy -0.4%.  Base Metals +0.05%.  Gold +0.72%.

Iron Ore -0.7%.

After 50 minutes of trading, XJO is down -0.3%.  I doubt we'll see a recovery today.

Happy New Year!

 Thu. p.m. 30/12/21.  XJO finishes flat today.

XJO was up just 3.6 points today or +0.05%.

The short-term trend is to the upside and the long-term trend is also to the upside.  

An important horizontal resistance level lies just above the current level - set back in late-August/early-September.  So a pull-back may not be far off.  Probably, any pull-back will be bought.

The short

Finspiration Australia. 14/11/23. Tues. Morning Report.

Mixed Results in New York.  Energy up. NAB ex-dividend today. Dow Jones +0.16%.  SP500 -0.08%.  Nasdaq -0.11%.  Small Caps -0.07%.  Banks -0...