Monday, December 20, 2021

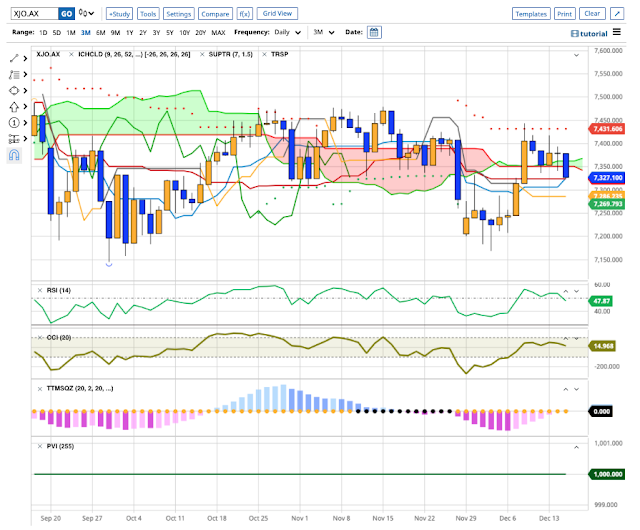
Mon. 20/12/21.  XJO fell today in choppy trading.

XJO down a little -0.16%.


XJO remains within its trading range.  

Today saw a lot of intra-day buying which resulted in the XJO bouncing off the 200-Day MA and the lower edge of the trading range.

That's promising - but we need to see a break above the trading range to be confident of a medium term bullish trend.

If we get an up day tomorrow - that would be a positive for our market.

At this stage in proceedings overseas, that is looking unlikely.  Germany is currently down more than -2.85%.  UK down -2.14%.  Dow Futures are down -1.67%.

Saturday, December 18, 2021

   Weekly Wrap, Week ended 17/12/21.  XJO rises from crucial level

XJO Monthly Chart:


XJO peaked in August, 2021.  It has since fallen September-November, but is now resuming its bullish trend in December.  This is important as it is moving up from a crucial long-term level - the 8-Month Exponential Moving Average.  December tends to be a seasonally bullish month for the market, so we may see more upside.

XJO Weekly Chart:


The weekly XJO Chart shows a decline this week of  -0.67%.  

The chart shows a wide trading range which switched the weekly trend from up to sideways.  A break above 7479 should be bullish.  A break below the 50-Week Moving Average (blue, curving line) would be bearish.

Currently, this week's candle is in the middle of the trading range.  This could go either way.


Daily XJO chart:


This week, XJO had two up days, two down days and one flat, but the down days overwhelmed the up days by -0.67%.

Given poor results in the U.S. on Friday night, we can expect a down day on Monday for our market.  That could see a test of the crucial 200-Day Moving Average.

One Week Sector Changes:

This week saw four sectors up, one flat (Energy) and six sectors down.  Health (XHJ) was the biggest loser, down -6.47%.  That was partly due to a big fall in CSL on Thursday when it was down -8.16%.  But some other stocks in XHJ also fell heavily.  For the week, COH - 3.72%, RMD -5.13%, RHC -3.61%, FPH 2.89%.

The best two performing sectors were Materials (XMJ) +2.33% and Property (XPJ) +2.25%.  Utilities (XUJ continues its recent good performance, up this week +1.4%.


NewHighs-NewLows Cumulative.

For long-term investors, this is one of the most important charts to watch.

The Cum NH-NL is now sitting above its 10-Day Moving Average after a small rise this week.  The chart is, however, trending sideways.  Wait.


The Strong-Weak Stocks Chart fell this week, providing a dis-confirmation of the Cum NH-NL.  We need to see congruence in those two charts to feel confident of direction 


Stocks in the ASX100 above the 200-Day MA.


% of stocks in the ASX100 above the 200-Day MA fell this week from 60% to 53%%.  That keeps it above the bearish level of 50%, but within comfortable striking distance of a bearish reading.

Cum Advances-Declines.

Cumulative Advances-Declines was up marginally this week, but remains in a bearish trend below its 10-Day Moving Average.


Conclusion: The XJO has been in a sideways trend for about three months.  The past week has not changed that situation.  Breadth Indicators (NH-NL, AD-DC, Stocks above 200-Day MA) are indecisive.  Wait.

We're coming into a seasonally favourable period - the fabled "Santa Rally" may be upon us this week.  The Santa Rally refers to an historically significant rise occurring in the last week of December and the first two days of January

It's important, however, to trade what you see not what you think.  Put ideas about "Santa Rally" to one side and watch the charts.  

Friday, December 17, 2021

 Sat. 18/12/21.  U.S. stocks fall for 2nd day.

Overnight:


Dow Jones -1.48%.  SP500 -1.03%.  Nasdaq -0.07%.  Small Caps +0.32%.  Banks -2.83%.

Options Expired on Friday, which may have had an effect on closing prices today.  

SP500:


Short-term trend is sideways, and in danger of breaking to the downside.  It currently has plenty of support:  Kijun-Sen, Supertrend and 50-Day MA, so I expect SP500 to bounce here after two days of downside action.

Commodities:

Commodities Index is in a sideways consolidation.  Dow today -1.18%.  Energy -2.01%.  Base Metals -0.23%.  Gold -0.21%.

Yesterday in Australia:


XJO was up a little +0.11% on Friday.  It remains within its trading range where it's been since September.

There's not much point in taking a position until it breaks out of this trading range.

Thursday, December 16, 2021

 Fri. a.m. 17/12/21.  U.S. Stock fall led down by Tech.

Overnight:


Dow Jones -0.08%.  SP500 -0.87%.  Nasdaq -2.47%.  Small Caps -1.63%.  Banks +0.11%.

Sp500:


SP500 is struggling to rise above horizontal resistance and set a new closing high.  The trend remains bullish - stay with the trend.

Commodities


Commodities Index +0.6%.  Energy +0.5%.  Base Metals +2.15%.  Gold +1.21%.

Iron Ore +4.6%.

Overnight Oz Futures +0.1%.

After 30 minutes of trading, XJO is once again defying the results from the U.S. overnight and is currently up  more than +0.4%.


 Thu. p.m. 16/12/21.  Despite strong gains overnight, the Australia market fell today.

XJO down today -0.43%.


XJO remains in a short-term down-trend, but in a medium-term sideways consolidation, basically going nowhere.

Today wasn't as bad as the raw figure for the XJO suggests.  Breadth was OK, with NH-NL = 15, and Advances -Declines = +97.  CSL was a big drag on the system today.  CSL -8.2%.  CSL is the third largest stock on the ASX200.  BHP fell -1%. CBA -0.1%.  Small Caps were up +1.8%.  Mid-cap 50 was up +0.15%.  So, it was a case of some large cap stocks falling while the rest of the market showed resilience. Not too bad in the scheme of things.

Wednesday, December 15, 2021

 Thu. a.m. 16/12/21.  U.S. Stocks rise strongly after Fed. decision announced.

Overnight:


Dow Jones +1.08%.  SP500 +1.63%.  Nasdaq +2.15%.  Small Caps +1.27%.  Banks +0.18%.

Major indices were hovering in negative territory before the Fed. decision was announced, but then rose strongly after the announcement.

SP500:

SP500 has bounced strongly off support and now close to a new record closing price.  Stay with the trend which is up.

Commodities:
Commodities Index +0.5%.  Energy +1.16%.  Base Metals -0.1%.  Gold +0.43%.

Iron Ore.  +1.3%.

Overnight Oz Futures +0.5%.

Despite all of the above good news, XJO is down a little just 15 minutes after trading -0.02%.  Maybe we'll see a rebound here.


Tuesday, December 14, 2021

 Wed. p.m. 15/12/21.  XJO falls on Fed jitters.

XJO down heavily -0.7%.


XJO is back to support of the Tenkan Sen and Kijun Sen.  Trend Finder is still negative.

In the larger scheme of things, XJO has been trading sideways for about three months.  Until that sideways range is resolved, it's best to stay away from new commitments in this market.

Finspiration Australia. 14/11/23. Tues. Morning Report.

Mixed Results in New York.  Energy up. NAB ex-dividend today. Dow Jones +0.16%.  SP500 -0.08%.  Nasdaq -0.11%.  Small Caps -0.07%.  Banks -0...