Friday, June 30, 2023

1/7/23. Saturday Finspiration Report.

Friday:  Australia flat.  Europe up.  America up.  Commodities up.

XJO.


XJO up marginally on Friday +0.12%.  We've had two days of doji candlesticks - the market basically going nowhere.

The chart is stuck in the middle of the Bollinger Bands and the Kumo Cloud, i.e., non-trending.

Overhead resistance is provided by the 50 Day MA and the Base Line and Conversion Line of the Ichimoku are sitting together, i.e., non-trending.

That seems likely to change for the first trading day of the second half of 2023 as U.S. finished up strongly.

U.S.

Dow Jones +0.84%.  SP500 +1.23%.  Nasdaq +1.45%.  Mid Caps +0.65%.  Small Caps +0.12%.  Banks 0.22%.

The three major indices (DJ, SPX, NDX) all started the session emphatically - gap up and kept going.

This could be a case of window dressing on the part of fund managers.  The three indices are now testing recent highs.  Watch for a fall back on Monday.

SP500.

SP500 is in an uptrend, sitting just above horizontal support.

Indicators are all bullish, but RSI14 is nudging on overbought with a reading of 69.2.  

Stay with the trend until otherwise indicated.

Commodities.

Commodities Index +0.84%.  Energy +1.16%.  Base Metals +1.07%.  Agriculture +0.87%.  Gold +0.67%,

Overnight in the U.S., BHP up marginally, +0.17%, Rio +0.06%, Woodside +0.5%.

Those Ozzie stocks trading in the U.S. are nothing to cheer about.

Sydney ASX Futures - up 0.4% - promises a positive start on Monday morning.


Thursday, June 29, 2023

30/6/23. Friday Morning Finspiration Report.

 Overnight in the U.S.  Dow Up.  Nasdaq flat.  Energy up.  Base Metals down.


Dow Jones +0.8%.  SP500 +0.45%.  Nasdaq -0.00%.  Mid Caps +1.19%.  Small Caps +1.65%.  Banks +1.82%.

SP500.


SP500 is in a short-term up trend.  

With one Supertrend yellow and two blue - doubts remain about the longer term trend.  Watch for a new higher high to confirm the longer term up trend.

Commodities. 

Commodities Index flat +0.04%.  Energy +0.8%.  Base Metals -0.65%.  Agriculture -0.57%.  Gold -0.11%.  Gold is very oversold but showed intra-day buying today.  That suggests that the longterm downtrend may be ending.  Continue to watch.

After 50 minutes of trading this morning, XJO is down -0.4%.  

ASX has a very large number of ETFs going ex-dividend today - that is having an impact on the broad market as well as the technical hurdles I mentioned last night.

29/6/23. Thursday Evening Finspiration Report.

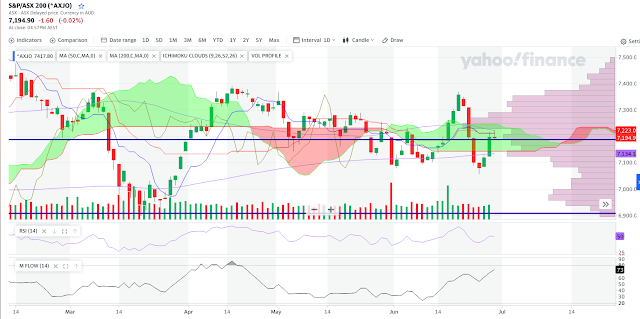
 After being up early in trading, XJO fell intraday to finish flat -0.02%.

Today the XJO hit resistance of the Base Line of the Ichimoku system and pulled back.

That also coincided with the Line of Control - the longest bar of the Volume Profile on the right of the chart.  The Line of Control is the region where the most volume has occurred for the XJO during the past six months.  That often acts as support/resistance.

So, on the basis of probabilities, the next movement for the XJO will be to the downside.  

Best performing sector today, by a long shot, was Info.Tech. (XIJ) up +1.81%.  Next best was XXJ (Financials) +0.53%.  Acting as a counter-weight to the rise in XXJ was XMJ (Materials) down -0.75%.

(Today, I've used a chart from Yahoo Finance - it is one of the few charting services which provide volume data for the XJO - although not for the current day.  What is it about the ASX that volume data for indices is so hard to access?  Beats me.  Volume is an essential tool for technical analysis - yet the ASX denies its use by retail investors.)


Wednesday, June 28, 2023

29/6/23. Thursday Morning Finspiration Report.

 Overnight in the U.S.  Mixed results in Equities.  Energy up, Base Metals down.


Dow Jones -0.22%.  SP500 -0.04%.  Nasdaq +0.27%.  Mid Caps =0.01%.  Small Caps +0.11%.  Banks -0.41%.

SP500.


SP500 was flat last night.  Tuesday's action was promising but we need to see more upside than we saw last night to confirm a return to the bullish rally.  Watch.

Commodities.


Commodities Index -0.31%.  Energy +1.12%.  Base Metals -0.83%.  Agriculture -1.13%.  Gold -0.23%.

After 50 minutes of trading, XJO is up +0.2%.  Banks are up, miners are down.

28/6/23. Wednesday Evening Finspiration Report.

 XJO up strongly today, +1.1%.


The ASX is still bonkers.  Daily move for the past two weeks have been very strong.

I shouldn't complain while the market is going up - but when it comes down - it comes with a big thud.

Daily RSI is higher than Weekly RSI so the market is in a counter-trend rally.  So far so good.

Ten out of eleven sectors were up today - but the strongest were a pleasant surprise.  Best was Discretionary +2.14%.  Does that mean the interest rate hikes are coming to an end?  Too soon to say, But Property was also up strongly +2.05%.  There seems to be a pattern forming.

Let's see what tomorrow brings.


Tuesday, June 27, 2023

28/6/23. Wednesday Morning Finspiration Report.

 Overnight:  U.S market up, Energy down, Base Metals up.


Dow Jones +0.63%.  SP500 +1.15%.  Nasdaq +1.54%.  Mid Caps +1.61%.  Small Caps +1.75%.  Banks +1.07%.

SP500.


SP500 bounced strongly off the 20-Day MA and back above the 8-Day EMA.  Expect more upside.

Commodities.

Commodities Index down -1.61%.  Energy -1.59%.  Base Metals +1.24%.  Agriculture -1.02%.  Gold -0.46%.


After 45 minute of trading this morning, XJO is up +0.67%.

27/6/23. Tuesday Evening Finspiration Report.

 XJO up moderately today, +0.56%.


Today's candle was a bullish engulfing candle.  That's encouraging - but - there's a lot of overhead resistance so it could be slow going from here on.

XPJ (Real Estate) +1.95% was the best performing sector today followed by XMJ (Materials) +1.16%.

Here's the XPJ chart:


That's a three-day bullish configuration on the chart.  Big down day, doji, big up day.  There seems to have been a massive change in investor sentiment.  The first Supertrend line has switched from bearish (blue) to bullish (yellow).

For the strong minded - that looks like a buy signal.  Note, however, that the Sector is still below the 200-Day MA.  Keep monitoring.


Monday, June 26, 2023

27/6/23. Tuesday Morning Finspiration Report.

 Overnight in the U.S.:  Dow flat, Nasdaq down.


Dow Jones -0.04%.  SP500 -0.45%.  Nasdaq -1.16%.  Mid Caps +0.78%.  Small Caps +0.61%.  Banks +0.64%.

SP500.


The trend remains to the down-side.  Chart is close to the 20-Day MA and horizontal support where the chart might return to the upside..  Watch.

Commodities.

Commodities Index flat +0.13%.  Energy +0.72%.  Base Metals -1.0%.  Agriculture -0.09%.  Gold +0.17%.

After 45 minutes of trading this morning, XJO up +0.45%.

26/6/23. Monday Evening Finspiration Report.

 It was a wonderful day in Brisbane today - if this bewinter, let's have dollops of it.

I wish I could say the same for the stock market today.  Yep - another great day for the beach, down at Burleigh Heads - or even Surfers (if you want to slum it).

But, it was another horrible day on the ASX - for the fourth day in a row.  XJO down -0.29%.  Well - I suppose that's not too bad considering what it has been like the previous two days.


Some intra-day buying did occur today - that's something.  Watch for carry through buying tomorrow.  A positive day tomorrow might signal the end of this pull-back.  Just don't hold your breath waiting for it.


Sunday, June 25, 2023

25/6/23. Weekly Finspiration Report.


That's been the story of the past two weeks.  XJO had a stunning rally to break upwards from its down-trend channel - only to fall back down an even more spectacular manner.  Crazy stuff.


XJO Daily Chart.


XJO down this week,  -2.1% after being up +1.81% the previous week.  The Index has broken out of its down-trend channel.

XJO is now back inside the down-trend channel and at horizontal support.  


American SP500.


This is what I said last week:  SP500 is in a strong up trend beginning in mid-March.  It is now at the top edge of the Standard Error Channel.  Expect a pull-back.

And on cue, the SP500 pulled back.  It is now close to three important supports:  the lower edge of the SEC, horizontal support, and the 200Day MA.  Those three in close proximity provide a powerful argument for a move back to the upside in the coming week.  That should save Australian stocks from further catastrophic falls.

Sector Performance this past week.


The only sectors up this week were the three Defensives, Utilities +1.47%, Staples _2.07%, Health +0.29%.  The rest of the market was dire.  Energy was poor, -4.85% followed by Info.Tech. -4.29% and Materials -3.79%.  Financials performed relatively well compared to resources, down -1.32%.  

Momentum.


A quick way to judge momentum is to compare the Weekly RSI and the Daily RSI.

By this method, XUJ, XSJ and XXJ have positive momentum.  

XXJ looks like a poisoned chalice.  Care needs to be taken in judging the relative merits of stocks in the Financial Sector.  Banks are still performing poorly, while Insurance stocks are doing well.  QBE was up this week, +0.79%, but suffered selling in the latter part of the week.  Medibank Private up +0.84%.  IAG up 2.54%.  Compare that to the banks.  ANZ -1.98%.  Westpac -0.77%.  NAB -0.27%.  CBA -0.85%.

I wouldn't rule XIJ out at this stage, even though momentum is negative.  XIJ did very strongly this week and may be returning to further strength.  But, the chart is saying to stick with Energy, Materials and Financials.

If looking for an alternative investment, Bitcoin seems to be back in bullish mode this week, up 16.52%.

I still like the Info.Tech. sector - but it is for trading not buy-and-hold.  None of the large caps in XIJ look appealing at the moment, but they'll come good again.  Traders can do well in stocks like WTC, XRO, TNE, NXT.

Mean Reversion.

The stock market tends to be mean reverting:  after a big rise, or a big fall, the market tends to revert to a longer term mean.

One set of data I keep which is something of a guide to when mean reversion will occur, it the difference between Implied Volatility and Historical Volatility.  Implied volatility is forward looking and historical volatility is backward looking.  Here's my chart for IV-HV:

IV-HV is now almost back to the level last seen in late March.  That was when a big fall in the XJO ended and reverted to the top side.  The XJO could fall a little more before IV-HV hits the same level as in late March, but its not far off.

Conclusion.

It's been a crazy week in the Ozzie market this week.  But the volatility might be coming to an end.  

Anything can happen in the stock market, as we've seen in the past two weeks with big jumps to the upside and the downside. 

A lot of factors are lining up, however, to suggest we'll see another move to the upside in the near future.

July is often a strong month in the stock market.  So be ready to pull the trigger.


Friday, June 23, 2023

24/6/23. Saturday Finspiration Report.

 Friday - felt like Armageddon.  XJO down,  Dow down, Nasdaq down, Europe down, Commodities down.

Armageddon - that is - if you're a normal person - but those dark villains on the "short" side (and I'm not talking about Friends of Snow White or Santa's Little Helpers) were chugging Dom Perignon out of crystal slippers previously worn by Princess Beatrice, who is by now sleeping rough in Piccadilly Circus.

XJO down -1.34%.

That takes the XJO down to just below the 200-Day MA - where it's been a couple of times recently - and then recovered.  

Well - anything is possible in this crazy stock market world, but this looks very different from those two previous efforts of flirting with the 200-Day MA.  

In the U.S. last night:


Dow Jones -0.65%.  SP500 -0.77%.  Nasdaq -1.01%.  Mid Caps -1.16%.  Small Caps -1.65%.  Banks -1.08%.

SP500.


SP500 is nowhere near as dire as the XJO.  It is way above the 200-Day MA.

As I've noted in the past, XJO decoupled from the American market a long time ago - that's due to the out-sized influence of Technology on the U.S. market - whereas, the Australian Tech sector has a small impact on our market.  The Oz market is more influenced by the resources sector which depend on China and Japan for markets.

Still, SP500 is showing weekness.  The three indicators in the lower panels are all on sell signals.

Two out of three super-trend lines have turned bearish.  But, the SP500 is back to the mid-line of the Andrew's Pitchfork, which suggests it might find support at that level.  We shall see.

Commodities.

Commodities Index -1.08%.  Energy -0.26%.  Base Metals -1.96%.  Agriculture -1.91%.  Gold +0.28%.

Those Energy and Base Metals prices provide little joy for our resources sectors.

In Sydney, SFE Futures for ASX200 is down -0.23%, which suggests a weak opening on Monday.


Thursday, June 22, 2023

23/6/23. Friday Morning Finspiration Report.

 In the U.S., Nasdaq up, Dow Jones flat.  


Dow Jones -0.01%.  SP500 +0.27%.  Nasdaq +0.95%.  Mid Caps -0.55%.  Small Caps -1.01%.  Banks -2.32%.

SP500.


Last night's bullish engulfing candle suggests that the pull-back is over.  I'd like to see follow-through buying.

Commodities.


Commodities Index -1.86%.  Energy -2.9%.  Nsdr Metals -0.16%.  Agriculture -0.99%

After 15 minutes of trading this morning, XJO is down -0.4%.

22/6/23. Thursday Evening Finspiration Report.

 XJO down heavily today. -1.63%.  Sell signal given by triple Supertrend lines.


NewHighs-NewLows Cumulative remains on a sell signal.


Triple RSI's are bearish.  Daily>Weekly.  Weekly>Monthly.


I don't have a crystal ball - I just follow my signals.

Anything can happen - but the signals are usually reliable.

Stay safe.

Wednesday, June 21, 2023

21/6/23. Wednesday Evening Finspiration Report.

XJO down today. -0.58%.

The index remains in an up-trend but has stalled at a major horizontal resistance level..  This might be the start of a pull-back but we need to see more evidence.


Tuesday, June 20, 2023

21/6/23 Wednesday Morning Finspiration Report.

 U.S. markets finish lower.


Dow Jones -0.72%.  SP500 -0.47%.  Nasdaq +0.16%.  Mid Caps -0.73%.  Small Caps -0.43%.  Banks -1.01%.

SP500.


SP500 gapped down at the opening suggesting this rally is over.

Intra-day buying kept losses fairly low.  

Any further pull-back should be an opportunity to buy-the-dip.

Commodities.

Commodities Index -0.89%.  Energy -1.25%.  Base Metals -1.78%.  Agriculture -0.41$.  Gold -1.04%.

Gold broke down from its recent consolidation - more down-side looks likely.

Plenty of intra-day buying occurred in Energy - it remains in a sideways consolidation.

In early trading this morning, XJO is down -0.2%.  Resources are affected most with the big miners all down.

20/6/23. Tuesday Finspiration Report.

 Another strong day on the Ozzie market.  XJO up +0.86%.


At times - a couple of times a year - the seems to be gripped by an irresistible force.  Now seems to be one of those times.  XJO up seven days in a row.

This seems to have enough momentum to test the high from mid-April.

Europe was down last night and has started on the down-side again tonight.  That didn't affect our market today!


Monday, June 19, 2023

20/6/23. Tuesday Morning Finspiration Report.

 U.S. markets closed for Juneteenth Holiday, so no data for U.S. equities or commodities.

European markets were weak.  German Dax -0.96%.  French CAC -1.01%.  UK Footse -0.71%.

After 20 minutes of trading this morning, Ozzie XJO is up +0.25%,  that's mainly on the back of better results, at this stage, of Energy +0.63% and Materials +0.39%.

Plenty of trading left in today - we'll probably be flat after the past two days of strong market action and no U.S. lead overnight.

19/6/23. Monday Evening Finspiration Report.

 Another good day on the XJO - the sixth day in a row.

XJO is in a strong up-trend.

Some storm clouds are gathering.  Short Term RSI2 became even more over-bought at 99.18.

Today saw switching into Defensives with Defensive Sectors doing best today.  Staples +1.61%.  Health +1.9%.  Utilities +1.16%.

NewHighs-NewLows still haven't given a "buy" signal.


XJO can still go higher - anything can happen, but it is now starting to look a bit long in the tooth.


Saturday, June 17, 2023

18/6/23. Weekly Finspiration Report.


(I'm glad I don't have a mortgage to service.)

XJO Daily Chart.


XJO up strongly this week,  +1.81%.  The Index has broken out of its down-trend channel.

The short-term RSI2 is now very over bought (above 90) for the first time since April.  It can, of course, remain over bought for some time as it did in March-April when the market continued to trend higher.  

The break out to the upside also negates the possibility of a head-n-shoulderts formation completing.  That's one worry off the plate.

American SP500.


SP500 is in a strong up trend beginning in mid-March.  It is now at the top edge of the Standard Error Channel.  Expect a pull-back.

Likely support is the first horizontal support line on the chart.

How any pull-back will affect Australia is a moot point.  While SP500 has been in a strong up trend, XJO has been in a down trend since mid-April.  Any strong pull back in the U.S. will undoubtedly affect Australia.  We'll just have to see how this plays out.

Chinese events are having a strong effect on the Ozzie market.  Recent loosening of credit in China could help Australia maintain a bullish profile.

XJO Weekly Chart - Something to keep in mind.


This week, XJO bounced strongly off the 50-Week MA and took almost everything in the market up with it.  Unless you were in Health Care (XHJ) this week, you've probably done very well - even the dart throwers are cheering.

Sector Performance this past week.


XHJ down this week -5.86%, after CSL posted a poor update to the market.  CSL fell -6.89% on the news on Wednesday and continued down on Thursday and Friday.

The rest of the market did well.  Info.Tech. came back with a vengeance this week, up 5.55%, followed by Financials (XXJ) up 3.38%.  XXJ seems to be returning to a positive stance.  This is its best week since October, 2022.  That started a strong up trend for Financials.  Perhaps the same can happen here?

Banks have been a drag on the XXJ but they performed well this week, MVB up +3.51%.

Momentum.


A quick way to judge momentum is to compare the Weekly RSI and the Daily RSI.

By this method, XMJ, XEJ and XXJ have positive momentum.  

Bonds (IAF), Gold Miners (XGD) and Health (XHJ) are looking a bit sick.

I wouldn't rule XIJ out at this stage, even though momentum is negative.  XIJ did very strongly this week and may be returning to further strength.  But, the chart is saying to stick with Energy, Materials and Financials.

Conclusion.

The Australian market broke out of its down trend this week.  Look to more upside but continue to monitor global market events.

Finspiration Australia. 14/11/23. Tues. Morning Report.

Mixed Results in New York.  Energy up. NAB ex-dividend today. Dow Jones +0.16%.  SP500 -0.08%.  Nasdaq -0.11%.  Small Caps -0.07%.  Banks -0...