Wednesday, May 31, 2023

1/6/23. Thursday Morning Finspiration Report.

U.S. Stocks fall while Law Makers play their fiddles.

Dow Jones -0.41%.  SP500 -0.61%.  Nasdaq -0.63%.  Mid Caps 1.39%.  Small Caps -1.31%.  Banks -2.47%.

Nasdaq has been leading the way, but divergence on the CCI suggests more downside to come.  Then it will depend on whether the Dow can pick up the slack.

SP500


SP500 has been under the influence of the Nasdaq.  It is also showing a negative divergence on its CCI so it will probably follow the Nasdaq to the downside.

Commodities. 


Commodities performed poorly overnight.

Commodities Index -1.12%.  Energy -2.04%.  Base Metals -0.51%.  Agriculture +0.1%. Gold +0.15%.

After 15 minutes of trading this morning, XJO has opened weaker -0.07%.  Not too bad after those weak overnight leads.
 

31/5/23. Australian market fell heavily today.

 XJO down -1.64%.


The chart is bearish.  

After such a poor day, coming at the low end of a down trend, we might get some relief to the upside.

After a weak lead from overseas Australia was also hit today with poor economic news out of China.  That hit our big niners very hard.  BHP -3.38%, Rio -2.1% and FMG -3.03%.

Japan =1.41% and Hong Kong -1.94%.

Europe is down modestly in early trading - STOXX600 down -0.22%.

America is still held spell bound by the Debt Ceiling dealings. U.S. Futures are down a little,

Dow Futs -0.18%.  SP Futs -0.21%.  Nas Futs -0.24%.

Tuesday, May 30, 2023

31/5/23. Wednesday Finspiration Report.

 Europe down, Mixed results in the U.S.

Dow Jones -0.15%.  SP500 flat +0.00%.  Nasdaq +0.32%.  Mid Caps -0.1%.  Small Caps -0.49%.  Banks +0.3%.

SP500.


SP500 finished flat after intra-day selling knocked down an early positive start.

The chart remains bullish with the 20DMA and 50DMA both pointed to the upside.  Supertrend 7/1.5 remains bullish (yellow) and the chart is above the Ichimoku Base Line.

U.S. stock Futures remain flat while the U.S. law makers play their games.

Commodities.

Commodities Index -2.32%.  Energy -3.53%.  Base Metals -0.95%.  Agriculture -0.62%.  Gold +0.62%.

Gold is about the only positive in an otherwise dreary landscape.

ASX has opened down this morning.  After a few minutes of trading, XJO is down -0.35%.

30.5/23. Australian market index barely moved today.

XJO down just -0.11%


The market remains. ndecisive. XJO finished sitting on the 50-Day MA which is point up.  It is just below the 20-Day MA which is pointing down.  Ichimoku Base Line is also above today's candle.

On the positive side, Supertrend 7/1.5 has yellow - that's bullish.

Overall - not one thing or the other.

Europe is currently mixed with DAX up, FTSE down and CAC down.

American Futures are positive.  Dow Futures +0.28%.  SP500 Futures +0.58%,  Nasdaq Futures going gangbusters +1.15%. 

BHP in London is up moderately, +0.44%.

We'll have to wait and see how American finishes tonight - but it is looking positive.

Monday, May 29, 2023

29/5/23. Monday Evening Finspiration Report.

No surprise today to see the Australian market surge higher.  XJO up +0.87%.  It was up higher early in the day but slowly lost elevation as the day wore on.  That's probably not surprising given the holiday in America tonight (Oz time).

Today was a good result for the XJO but no "Get out of Jail" Card.

We need to see XJO break above recent horizontal resistance at around 7290.

Today's solid bounce came off horizontal support and took the Index marginally above the 50-Day MA.  I'd like to see the Index break above horizontal resistance before claiming a victory for XJO.  But - today's action is promising.
 

Sunday, May 28, 2023

28/5/23. Weekly Finspiration Report.

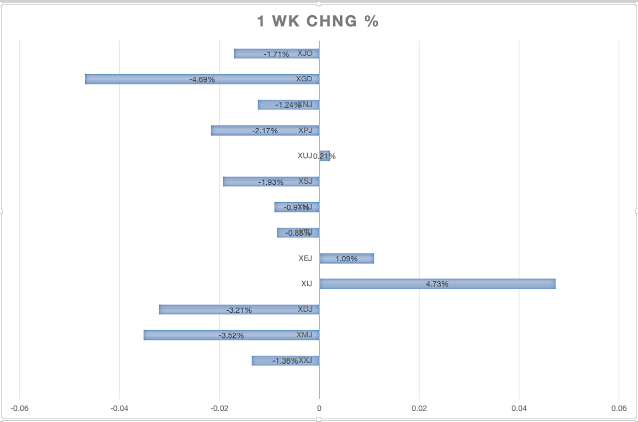
 It's been a rough week for the Australian Stock Market, XJO down heavily -1.71%.  That's the worst weekly result since mid March.  Only three out of eleven sectors were up.  The best, by a long way, was Information Technology (XIJ +4.73%)

OK, let's get into the details.

XJO Daily Chart.


Triple Supertrend Lines are giving "sell" signals (all blue).

The chart isn't all negative despite the Supertrend Lines.  The chart is close to support of the 200-Day MA, and the low of 5 April.  It is also right on the support of the Ichimoku Base line which is running horizontal from 27 March to 14 April.  MACD Histogram is also showing a marked positive divergence to the XJO Chart.

The XJO on Friday had a narrow range day inside the wide range of Thursday.  If a big up day occurs from here, the XJO will have a significant three-day reversal pattern.  Given that Ozzie Futures are currently at +0.99%, that sounds like a done deal.

XJO, as often happens, is lagging well behind the American market where the Nasdaq has been going gang-busters.  Unfortunately, Australia has a small tech sector (but see XIJ above) so that is the reason we often lag behind the U.S.  If our resources show strength, however, out market often plays catch-up.

American SP500.


The SP500 chart is bullish.  The Triple Supertrend Lines are bullish (all yellow).  The chart is well above the 50-Day MA (blue curved line) which is curving to the up-side.

MACD Histogram is above its zero line - that's bullish.

The chart is now at horizontal resistance.  A break higher would be very bullish as that would be a new 52-Week high.

The American market is closed on Monday so we might have to wait until Wednesday morning Oz time to see if the U.S. breaks to the upside.

Sector Performance this past week.


In this bar chart, we can see the out-performance of Information Technology (+4.73%.  Only two other sectors were positive, Energy (XEJ +1.09%) and Utilities (XUJ +0.21%).

The worst performing sector was Materials (XMJ -3.52%).  We could see a rebound in that sector on Monday as both BHP and Rio were up ~3% on Friday night in the U.S.

The next worst sector was Discretionary (XDJ -3.21).  That's clearly a result of the belt-tightening which has occurred by the RBA's recent raising of interest rates to an eleven year high.  Pundits (e.g. CBA) are expecting a pause in interest rate rises in May - economists are suggesting about a 90% certainty that no interest rate rise will occur at the next RBA meeting on June 6.  That might take the pressure off XDJ just a little.

Gold Miners, which is a sub-set of Materials, has been taking a beating lately, but on a one year basis is a good performer.  GDX (Gold Miners ETF) is one of those stocks worth trading if you can handle the necessary technical analysis.  Here's the GDX chart:


When the Supertrend Lines are all yellow and the chart is above the Ichimoku Base Line, we have a "buy" signal back in mid-March.  Traders were well prepped by a move off the 200-Day MA and a big positive divergence on the CCI.

In mid-May, GDX gave a "sell" signal with the Supertrend Lines all blue and the chart breaking below the Ichimoku Base Line.  That occurred on 12 May.

The chart is now prepping traders for a reversal to the upside, with a positive divergence on CCI and MACD Histogram.

That's not a "buy" signal - just a "get ready" signal.

Personally, I'd wait for a Triple Supertrend Buy Signal (all yellow) and a break back above the Ichimoku Base Line.  Keep watching and waiting.  This could, of course, keep heading down for some time yet.

Sector Momentum.

A quick way to check momentum is to compare the daily RSI with weekly RSI.  If daily RSI is below weekly RSI, then momentum is negative, or bearish.  Vice versa, if daily RSI is above weekly RSI, then momentum is positive or bullish. 


Three sectors are showing positive momentum (bullish).  Information Technology (XIJ), Energy (XEJ) and Financials (XXJ).

Positive momentum in XIJ and XEJ is no surprise, but XXJ looks like one out of the box.

Unfortunately, not all Stocks in XXJ are created equal.  There is a big difference between some of the insurers and the big banks.  Consider the following:

IAG


SUN


NAB


WESTPAC


There is a clear difference between IAG/SUN and NAB/WBC.

It's not all bad news for the Banks.  The above two bank charts may be prepping investors for a move to the upside as some positive divergences are showing up on indicators.  Watch.

New Highs and New Lows


NewHighs-NewLows sometimes gives advance warning of changes in the market when the chart is at extremes.

12-17 April showed a negative divergence and the XJO commenced a fall on 18 April.

NH-NL is now showing a positive divergence - so it is prepping us for a move to the upside.  No guarantees - watch.

Conclusion.

The Australian market had a poor week, but appears to be setting up for an upside move.  No Guarantees but watch and act if we see definite moves to the upside.


Friday, May 26, 2023

27/5/23. Saturday Finspiration Report.

 XJO up modestly on Friday, +0.23%


Friday was a narrow range day well within the range of the previous big down day on Thursday.

XJO has paused at support from early May and at the 50% retracement of the big rally in March/April.

That support is likely to hold.

Overnight in the U.S.

American indices had a strong night last night (Oz time).


Dow Jones +1.00%.  SP500 +1.3%.  Nasdaq +2.19%.  Mid-Caps +0.95%.  Small-Caps +1.13%.  Banks +0.97%.

SP500.


Triple Supertrend Lines have given a "buy" signal by switching to all Yellow.

SP500 is now at horizontal resistance, but current momentum should be able to overcome than.

Investors seem to be betting that a Debt Ceiling deal will be agreed to before financial armageddon descends on America.

Monday, the U.S. market is closed for Memorial Day.

Commodities.


Commodities Index +1.6%.  Energy +1.28%.  Base Metals +2.4%.  Agriculture +0.83%.  Gold +0.4%.

BHP was up strongly in New York, +2.98%.  Rio up +2.91%.  Woodside up +2.08%.

All of that looks good for the ASX on Monday, especially resources.

Thursday, May 25, 2023

26/5/23. Friday Morning Finspiration Report.

Mixed results in the U.S.  Dow down.  Nasdaq whooshka.  What the heck?


Dow Jones -0.11%.  SP500 +0.88%.  Nasdaq +1.71%.  Mid-Caps -0.00%.  Small-Caps -0.32%.  Banks -0.19%.

What the heck?  Indeed.  Read "Nvidia".  Nvidia's report shot the stock up into the mega-cap realm along with Apple, Alphabet and Microsoft - One Trillion plus Cap.

That ignited the Nasdaq shooting it into the stratosphere.

Stodgy old Dow Jones Industrials was left behind.

But ... see all those long tails on today's candles?  Plenty of intra-day buying everywhere in the market.

SP500


That's a good rise in the SP500, but it's not out of the woods yet - or should we say out of the (narrow) Bollinger Bands (20/1).  It remains in "" (mixing up a few metaphors there).  It still has Supertrend above it and HullMA13 remains pointed down.

SP500 remains indecisive.

Commodities. 


Commodities Index -1.58%.  Energy -2.05%.  Base Metals -0.23%.  Agriculture -1.11%.  Gold -0.96%.

Base Metals with an RSI of 27.22 is now very oversold, so we might see an end to this plunge in the near future.  It will be interesting to see how Oz big miners act today.

After half an hour of trading this morning, XJO is flat, up just +0.06%.  And BHP is up +0.55%.  WOW


25/5/23. Thursday Evening Finspiration Report.

Australian market down heavily today.

XJO down today -1.05%

Today was the fourth day down in a row and the biggest decline so far.

The chart is bearish, but today's decline was so large we could see some upside action tomorrow.

Europe has opened on the down side.  German DAX -0.46%.  UK FTSE -0.34%.  French CAC -0.33%.

American Futures are looking more promising, although Dow Futures are down -0.28%.  SP500 Futures +0.52%.  Nasdaq +1.62%.

That suggests a better night in the U.S. tonight (Oz time).
 

Wednesday, May 24, 2023

25/5/23. Thursday Morning Finspiration Report.

 U.S. Stocks down.  Energy up. Base Metals down.

Dow Jones -0.77%.  SP500 -0.72%.  Nasdaq -0.61%.  Mid caps -1%.  Small Caps -1.27%.  Banks -1.77%.

SP500.


SP500 is sitting on the 50-Day MA which could act as support.

Currently, this is a news driven market.  Or, perhaps we should say, a no-news driven market, as the Debt Ceiling talks drag on, with no resolution in sight.

Both sides playing brinkmanship - which will resolve before disaster occurs.

Commodities.


Commodities Index flat +0.04%.  Energy up +1.22%.  Base Metals -1.57%.  Agriculture -0.53%.  Gold -0.81%.

Australian Futures down about -0.5% - so we'll have another weak opening.

u

24/5/23. Australian Market falls heavily today.

 XJO Down -0.65%.

XJO has support of the Supertrend just below it.  Then it will hit the 200-MMA where it's been a couple of times recently.

U>S. Futures are down, SP500 futures down -0.99%.  

EuroSTOXX600 currently down -1.6%.

It's not looking too hopeful for tonight or tomorrow.

Tuesday, May 23, 2023

24/5/23. U.S. markets very weak.


Dow Jones -0.69%.  SP500 -1.12%.  Nasdaq -1.26%.  Mid Caps -0.99%.  Small Caps -0.11%.  Banks +0.65%.

SP500.


SP500 has broken below the lower support line of the up-sloping bearish wedge.

Just below is a bunch of indicators - 20-Day MA, Supertrend and Kijun Sen (Ichimoku Base Line).  A break down through those will probably see more falls - looking to the 200 Day MA.

Commodities.

Commodities Index +0.4%.  Energy +0.77%.  Base Metals continue to slide -1.87%.  Agriculture -0.1%.  Gold flat +0.12%.

In New York, BHP was down -1.5%.  Rio down -1.76%.  Woodside flat -0.09%.

ASX Futures down -35 Points - about -0.5%.

23/5.23. ASX finishes Flat.

XJO Chart.


 XJO down marginally today -0.05%,

The Index is above the 200-Day MA and the Supertrend (7/1.5) but sitting right on the 20-Day MA (mid-point of the Bollinger Bands) and the Kijun Sen (mid-point of the past 26Days).  So this could go either way.  If it falls, there is plenty of near-by support.

Wait.

Monday, May 22, 2023

Finspiration Australia.

 23/5/23.  Tuesday Morning Finspiration Report

Overnight.  Mixed results in the U.S., Down Down, Nasdaq Up.


Dow Jones -0.42%.  SP500 +0.02%.  Nasdaq +0.5%.  Mid Caps +0.52%.  Small Caps +0.74%.  Banks +1.75%.

SP500.


 All indicators on this chart remain bullish - but the upsloping wedge suggests a move to the downside.

Ambiguous.

Commodities.

Commodities Index flat +0.09%.  Energy flat -0.05%.  Base Metals down -1.3%.  Agriculture flat -0.1%. Gold down a little -0.23%.

After 20 minutes of trading this morning, XJO is up +0.3%.  Energy is leading the way, up +1.2%.

XJO remains in its sideways consolidation.

Finspiration Australia.

22/5/23.  XJO finished down a little today.


XJO down -0.22%.  It is still basically in a sideways consolidation pattern.  It needs to finish above the Supertrend Line (that's the blue line just above the chart heading sideways).

Dow Futures are currently flat - 0.0%.

It seems that not much will happen until the Debt ceiling discussions are finalised.


Saturday, May 20, 2023

Finspiration Australia


 Sunday, 21 May, Weekly Report. Australian Market.

The week started poorly but the past couple of days saw an improvement as a "miracle" in the American debt ceiling talks seemed probable.

XJO Daily.


XJO finished up a moderate +0.31% for the week but remains in a sideways consolidation movement.

Weekly Performance of Sectors (plus Gold Miners, XJO and Bonds)


Five sectors up, five sectors down and one flat.  Information Technology +5.19% continued its good work from the previous week when it was up +1.97%.  XEJ, which can be quite volatile, was up +1.6% after being flat the previous week. 

The main defensive sectors suffered again this week.  XHJ down -0.69%, XSJ -1.08%, Utilities -0.22%.  Investors seem to be positioned for a risk-on market with a move out of defensives. 

Morningstar classifies the sectors into three groups, 

  • Cyclicals - XMJ, XDJ, XXJ, XPJ.  These have strong correlations to the business cycle.  
  • Sensitive - XTJ, XEJ, XNJ, XIJ.  These have moderate correlations to the business cycle.
  • Defensives - XHJ, XUJ, XSJ.  These tend to have low correlations to the business cycle.

    The "Sensitive" group did well this week with three sectors up and one flat.  XIJ was the best performing sector, followed by XEJ, while XTJ was the fourth best performer.  So three out of the four best performers this week came from the Sensitive group  

    Momentum

    The following data is a medium term measure of momentum obtained by subtracting Weekly RSI from Daily RSI.

    The only sectors with positive upside momentum are Property (XPJ), Energy (XEJ), Telecomms (XTJ) and Information Technology (XIJ). 

    XIJ has continued its dominance this week.  The sector is getting a little long in the tooth - if you hold strong stocks in that sector -  good for you.  It's probably too late now for non-holders to go chasing those stocks (e.g. XRO, WTC).

    Besides XIJ, the big improvers this week were Energy (XEJ) and Financials (XXJ).  Strong stocks in those sectors might be worth a look in the next week. 

    SP500 Daily Chart.


    SP500 had a strong week this week with hopes that a solution to the Debt Ceiling impasse was probable.  SP500 was up +1.65% this week with most of that coming on Wednesday and Thursday (NY time).

    The Index is in an Upsloping Bearish Wedge.  In my experience, these have a high probability of breaking to the down-side.

    Yesterday, in my Saturday blog, I mentioned that the current up-trend could be a "sucker rally" hasNYSE and Nasdaq breadth hasn't improved in the same way as the Index.

    That adds to the probability that the upscoping wedge will break to the down-side.

    Take care.  If a debt ceiling agreement is reached - it might be a case of "sell the fact".

    Stocks/Bonda Ratio.


    The Stocks/Bonds Ratio Chart has climbed above the zero line so Stocks are currently out-performing Bonds - risk-on.  But,  it is usually best to wait until the 5-Day MA breaks above the 21-Day MA before feeling comfortable about a medium term rally in stocks. 


    Conclusion.

    XJO remains in a sideways consolidation.  Investors appear to be positioning for a risk-on market, with cycling out of Defensives Sectors and into Sensitive Sectors, and, to a lesser extent, into Cyclical Sectors.

    SP500 may be setting up for a move to the downside after a strong week after improving Debt Ceiling talks.  If SP500 does drop, we will probably follow and could break to the downside of the current consolidation.

    Stay safe.

    Friday, May 19, 2023

    Finspiration Australia.

     20/5/23.  Saturday Morning Finspiration Report.

    In Australia yesterday.


    XJO up yesterday +0.59%.  The daily candle finished at horizontal resistance from 8 May.

    Yesterday's candle finished marginally above the Base Line of the Ichimoku System.  (Base Line, black, is the mid-point of the last 26-periods.).

    The Conversion Line remains below the Base Line.  (Conversion Line, blue, is the mid-point of the last nine periods.). We need to see the Conversion Line above the Base Line for a bullish context.

    Overnight in America.


    Dow Jones -0.33%.  SP500 -0.14%.  Nasdaq -0.24%.  Mid Caps -0.89%.  Small Caps -0.74%.  Regional Banks -1.76%.

    Regional Banks came into focus again last night after U.S. Treasury Secretary, Janet Yellen, said more mergers might be necessary.

    SP500.


    SP500 is at the top edge of an upscoping bearish wedge.  Watch for a fall back to the lower edge of the wedge.  A break lower would be bearish.

    Sucker Rally?

    To check if the current upside move is a "sucker rally" I'm looking at the NYSE Advance-Decline Line.


    Comparing the NYAD Line with the SP500 we can see that NYAD is showing a negative divergence from the SP500 - so - yes, this probably is a sucker rally.

    Here's the chart for QQQ (ETF for Nasdaq).


    Since early May, QQQ (Nasdaq) has been in a very strong up-trend.

    Here's the Advance-Decline Line for Nasdaq:


    NAAD is in a negative diversion from Nasdaq and at the lower end of its daily chart.  That's in marked contrast to Nasdaq which is now way up at the top of its chart - and overbought.

    The only conclusion that can be drawn is that the market has been dragged up by a few large tech stocks.  That's a precarious position to be in for the market.

    Gold.


    Gold came roaring back to life last night, up +0.99% after being in a short-term down-trend since 10 May.  It still has work to do to prove its bullish credentials, but it does look promising.


    Finspiration Australia. 14/11/23. Tues. Morning Report.

    Mixed Results in New York.  Energy up. NAB ex-dividend today. Dow Jones +0.16%.  SP500 -0.08%.  Nasdaq -0.11%.  Small Caps -0.07%.  Banks -0...