Tuesday, January 31, 2023

Finspiration Australia

 1/2/23.  Finspiration Evening Report.

XJO up +0.33% today after being up much higher early in the day.


Today's action could be a failed breakout.  Early trading took the Index above the high of Tuesday's action then fell back below that high.

Below is a three-day chart which clearly shows the failed break-out.


We need to see continued selling on Thursday to confirm the failed break-out.

FINSPIRATION AUSTRALIA.

    1/2/2023.  Finspiration Wednesday Morning Report.

U.S. stocks push higher after Monday's sell-off.


Dow Jones +1.09%%.  SP500 +1.4%.  Nasdaq +1.67%.  Small Caps +2.53%.  Banks +1.69%%.

SP500.


On Monday, SP500 fell back to the 8-DEMA and the old oblique resistance line.  That has held as support which suggests more upside.  

Commodities.


Commodities Index+1.72%.  Energy +2.03%.  Base Metals +1.2%.  Agriculture +1.25%.  Gold +0.36%.

XJO, after 60 mins of trading, is up +0.8%

Bitcoin.

Bitcoin was up 0.8% last night.  It continues to lie within its consolidation zone and remains above the 8-Day EMA and Supertrend.  Investor sentiment remains positive while it remains above those two indicators.  Watch for a definite move above 200-DMA>


 31/1/23.  Finspiration Monday Evening Report.

XJO finished down just a little again today -0.07%.   A surprise came early in trading with the XJO up strongly but it gave back the early gains to finish more or less flat.  Today's range was a narrow range inside the range of the previous day - that's indecision.


It's too early to say that this is the start of a pull-back, but it could be.  XJO remains above the 8-Day EMA and Supertrend (7/1.5).  A break to the downside of those two would signal a short-term pull-back.

The three big iron ore miners did well today, BHP +0.3%, Rio +0.9% and FMG +0.23%.  Despite that XMJ (Materials) fell heavily -0.8%.  That's unusual.  So what happened.  Look no further than the Lithium Miners: Allkem -7.5%, Lake Resources -6.9%, Novonix -6.2% and Liontown -5.7%.

Woolworths surprised to the upside +3.8% after an encouraging assessment by a broker

It's a big week for Central Banks this Week with U.S., U.K. and Europe all making interest rate announcements later this week.  Those announcements are likely to be market movers.  Until those announcements we'll probably continue to see our market waffle around.


Monday, January 30, 2023

   31/1/2023.  Finspiration Tuesday Morning Report.

U.S. stocks finish lower.


Dow Jones -0.77%%.  SP500 -1.3%.  Nasdaq -1.96%.  Small Caps -1.08%.  Banks -0.91%.

SP500.


SP500 has formed a bearish kicker pattern.  (Previous day, up, today down).  Dow Jones (see first chart above) has formed an evening star pattern.  Expect more selling.

Plenty of support remains nearby - so the pull-back may not be too strong - depends on what the Fed. does and says later in the week.

Commodities.


Commodities Index -1.29%.  Energy -2.39%.  Base Metals -1.54%.  Agriculture +0.55%.  Gold -0.26%.

Friday's sell signal (StochRSI below mid-line) played out today.  Wait for StochRSI to rise back above mid-line before re-entering.

Despite the bearish lead from Wall St, XJO, after 45 mins of trading, is up +0.26%

Bitcoin.

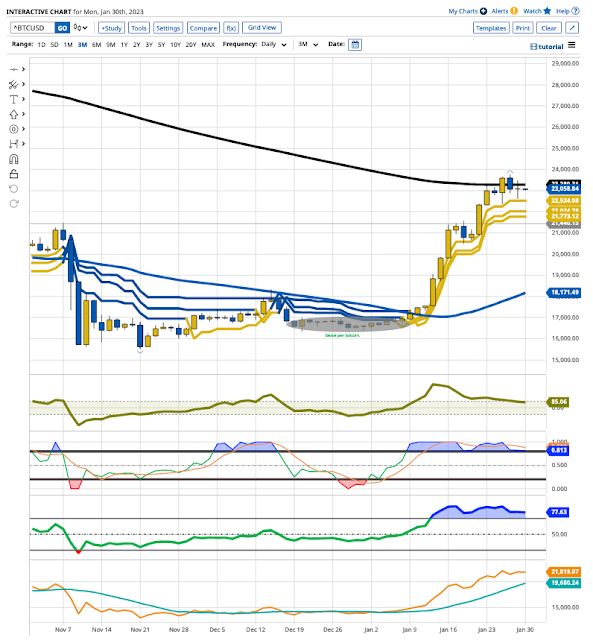
Bitcoin was down -1.49% last night.  It continues to lie within its consolidation zone and remains above the 8-Day EMA and Supertrend.  Watch for more downside.


Bitcoin continues to hover around the 200-Day MA.  It remains above the 8-Day EMA and the Supertrend.  While it stays above those, holders can breath easily.


Negative divergences on indicators are starting to play out.  Plenty of support exists nearby.    A modest pull-back could provide a chance for bitcoin punters to get set for another surge to the upside. 

Sunday, January 29, 2023

Finspiration Australia. Chart Analysis of Australian and International Stock Markets

30/1/23.  Finspiration Monday Evening Report.

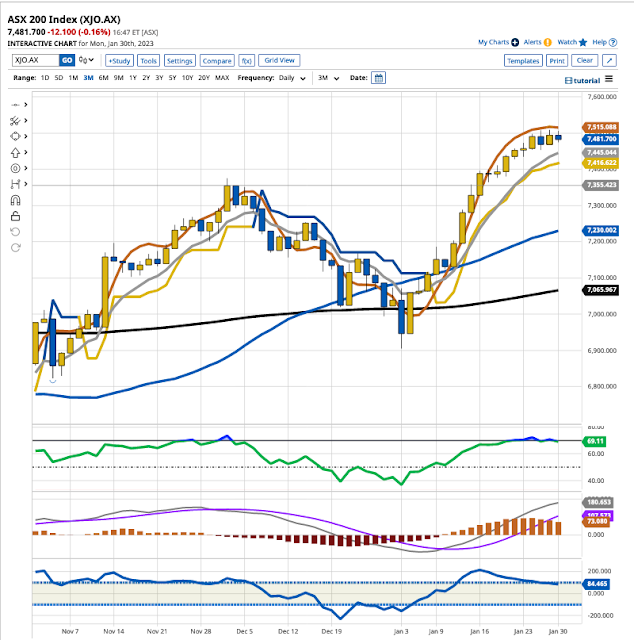
XJO finished down just a little today -0.16%. 


It's too early to say that this is the start of a pull-back, but it could be.  XJO remains above the 8-Day EMA and Supertrend (7/1.5).  A break to the downside of those two would signal a short-term pull-back.

Six sectors were down today and five up. Tech did best +2.6% followed by Telecommunications +1.1.  Worst were Staples and Health both down -0.7%.

It's a big week for Central Banks this Week with U.S., U.K. and Europe all making interest rate announcements later this week.  Those announcements are likely to be market movers.


NH-NL Cum remains safely in bullish territory providing long-term investors with a degree of comfort.

Below is a chart of Historical and Implied Volatility.


Historical Volatility (blue line) is down around a level seen recently three previous times.  Each of the prior times has been at or close to a reversal point.  No guarantees - but one should be prepared for a pull-back.


Saturday, January 28, 2023

Finspiration Australia. Chart Analysis for Australian and International Stock Markets

 29/1/23.  Weekend Report - The Week That Was.  Week Ended 27/1/23.

Stock Market Adage:  "As goes January, so goes the year."  Described first by Yale Hirsch in 1972, since 1950 it has an 85.7% accuracy

 Chart Analysis on this Blog is purely descriptive.  It is written for informational and educational purposes and should not be taken as financial advice.  Do your own research or seek advice from a Registered Financial Advisor.

This week saw further upside in the broad market.

XJO Monthly Chart.


XJO has been up +6.47% in January with one more trading day to go.   The Index is above the 8-MEMA, Hull MA13, 50-MMA, 200MMA, Supertrend (7/1.5).  Supertrend was the last domino to fall.  If it remains bullish into the end of January (and I see no reason why it shouldn't), we can say we have a new bull market on our hands.

Monthly RSI is at 57.46

XJO Weekly Chart.


In the past five days, XJO risen +0.56%.  XJO Weekly is in an uptrend - higher highs and higher lows.

8-Week EMA, Hull MA13 and Supertrend are all heading to the upside.

Weekly RSI is at 64.73.  That's above the Monthly RSI of 57.46, which indicates bullish XJO momentum.


XJO Daily Chart.


XJO has been in a strong up-trend since early January.  Daily RSI is now at 70.83 - that's overbought.  The last time XJO had an overbought reading was back in early December, 2022, which precipitated a fall back to the 200-Day MA.  Watch the market here for a pull-back.  I'd expect support at the 50-Day MA, which would be about a 50% retracement of the recent rise.

Monthly, Weekly and Daily RSIs. - Sectors + XJO + Gold + Composite Bonds


The above column chart shows the Monthly, Weekly and Daily RSIs for each sector.  This provides information re momentum and investor sentiment.

XDJ and XJO are short-term overbought with RSI >70.  Expect consolidation or a pull-back in the coming week.

XXJ with an RSI at 69.88 is close enough to 70 - so we can expect consolidation or a pull-back for that important sector.

In the previous week, XMJ was overbought (>70 RSI).

Here's the daily chart for XMJ:

BHP has recently been the strongest sector in the ASX.  Both times recently when RSI for BHP went above 70 small pull-backs occurred, but no change in trend as indicated by the 8-Day EMA and Supertrend (7/1.5).  An overbought reading doesn't necessarily mean a trend reversal, particularly when the market is in bullish mood.


NewHighs-NewLows Cumulative.

This is a long-term lagging indicator.


NH-NL Cum is represented by the blue line.  It is now above the 10/21/34 Day Moving Averages.  The 10-DMA is above the 21-DMA and 34-DMA.  This is a very bullish configuration.  While the NH-NL CUM remains above the 10-Day MA, long-term investors can fell comfortable about their investments.

I've developed another long-term metric "StrongStocks-WeakStocks" which is similar to NH-NL but gives signals a little earlier than NH-NL  SS-WS is up for the 11th week in a row and has moved well above its 5-Week MA.   This week there were 25 Strong Stocks and 1 Weak Stock.   That's not quite as strong as the previous week but still a very good result.


% of Stocks above key moving averages.

1.  % of stocks above 10-Day Moving Average: Last Week 66%, This Week 70%.  
2.  % of stocks above 50-Day Moving Average, Last Week 77%, This Week 75%.  
3.  % of stocks above 200-Day Moving Average, Last Week 64%, This Week 69%.  

All three indicators are bullish hovering around the 70% level.  

Overbought for the market occurs when % of stocks above 200-DMA rises above 80%.  We're not there yet.

Conclusion.
 
January has done well for the XJO and most Sectors are now giving bullish momentum readings..

XJO is overbought with an overbought RSI >70.  XDJ is also >70.  

Although XMJ has recently recorded a couple of RSI above 70, pull-backs have been muted, indicating a strong bullish market.

Internal strength (breadth) remains strong.

All trends end eventually as this one will, but we're not seeing any convincing evidence as yet.  Stay with the trend.

Friday, January 27, 2023

Finspiration Australia. Chart Analysis for Australian and International Stock Markets + Bitcoin.

 28/1/23.  Finspiration Saturday Report.

Dow Jones flat, Nasdaq up.


Dow Jones +0.08%.  SP500 +0.25%.  Nasdaq +0.95%.  Small Caps +0.36%.  Banks +0.55%.

SP500 Daily and Weekly Charts.


Both Daily and Weekly Charts are bullish with triple Supertrend Lines showing yellow (Bullish)

Daily SP500 has moved above the 200-Day MA and its downtrend line.  The chart is now hitting horizontal resistance.  The chart must finish above both horizontal and oblique lines to prove the down trend is over.

XJO Daily Chart.


XJO is overbought and consolidating at the highs.  CCI shows a negative divergence suggesting a pull-back may be coming.  But, until we see definite evidence otherwise, stay with the trend.

Commodities.


Commodities Index suffered a reversal last night, down -1.12%.  Energy -1.82%.  Base Metals -1.21%.  Agriculture +0.2%.  Gold showed intra-day buying but finished down a little, -0.14%.

BHP fell in New York, -1.91%, but the uptrend remains bullish.  Rio also fell -0.98% but showed plenty of intra-day buying after falling heavily in early trade.  It rebounded at the key 11.00 (NY time) reversal segment.

Bitcoin.


Bitcoin finished flat last night +0.08%.  It continues to consolidate around the 200-Day MA.  

CCI suggests a pull-back may occur, but the best policy, I believe, is to stay with the up-trend until evidence suggests otherwise.

Thursday, January 26, 2023

   27/1/2023.  Finspiration Friday Morning Report.

U.S. indices finish strongly after shaky start.


Dow Jones +0.0.61%.  SP500 +1.1%.  Nasdaq +1.76%.  Small Caps +0.69%.  Banks +0.98%.

SP500.


SP500 has finished above its down-trend line which has held it down for many months.  Stay with the trend.

Commodities.


Commodities Index +0.44%.  Energy +0.54%.  Base Metals +0.36%.  Agriculture +1.38%.  Gold -0.91%.

StochRSI has fallen below its mid-line.  That's usually a pull-back signal.

Overnight events suggest Australia will do well today.  After one-hour of trading XJO is up +0.24%.

Bitcoin.

Bitcoin was down -2.2% last night.  It continues to hover around the 200-Day MA.  


Bitcoin continues to hover around the 200-Day MA.  It remains above the 8-Day EMA and the Supertrend.  While it stays above those, holders can breath easily.


Negative divergences on indicators are starting to play out.  Plenty of support exists nearby.    A modest pull-back could provide a chance for bitcoin punters to get set for another surge to the upside.

Wednesday, January 25, 2023

  25/1/23.  Finspiration Wednesday Evening Report.

XJO finished down modestly -0.3% today. 


 XJO has fallen out of overbought territory (RSI >70) after three days above 70.

It's too early to say that this is the start of a pull-back, but it could be.  XJO remains above the 8-Day EMA and Supertrend (7/1.5).  A break to the downs by those two would signal a short-term pull-back.

Sectors were down today and four up. Discretionary +0.4%and Financials +0.3% were the best performers.  Info.Tech and Energy were the worst, both down -1.2%.


Australian market is closed tomorrow for a public holiday.

Stay Safe.

Tuesday, January 24, 2023

Finspiration Australia. Chart Analysis for Australian and International Stock Markets. + Bitcoin

  25/1/2023.  Finspiration Wednesday Morning Report.

Major U.S. indices finish flat after falling in early trade.


Dow Jones +0.03%.  SP500 -0.02%.  Nasdaq -0.18%.  Small Caps +0.28%.  Banks +1.59%.

SP500.


SP500 continues to respect the down sloping trend line where it has failed before.  Crucial time.

Commodities.


Commodities Index -0.28%.  Energy -1.05%.  Base Metals +0.32%.  Agriculture +0.26%.  Gold +0.46%.

In New York, BHP +1.43%, Rio +1.13%.

Bitcoin.

Bitcoin was up +3.01% last night.


Bitcoin continues to hover around the 200-Day MA.  It remains above the 8-Day EMA and the Supertrend.  While it stays above those, holders can breath easily.


Negative divergences on indicators are starting to play out.  Plenty of support exists nearby.    A modest pull-back could provide a chance for bitcoin punters to get set for another surge to the upside.

Monday, January 23, 2023

 24/1/23.  Finspiration Tuesday Evening Report.

XJO finished up +0.4% today - and that's the first time in six months that it has been up five days in a row. That's coming at the top of a long up-trend.  Are we seeing a little "irrational exuberance" creep into the Ozzie market.


 XJO remains in overbought territory (RSI >70) for the third day in a row.  RSI now at 72.32.

It remains overbought with an RSI >70.  CCI is showing a negative divergence which suggests we will see a pull-back in the near future.

Four best performing sectors today were:  Property +1.8%, Materials +1.3%, Info Tech +1.3% and Consumer Discretionary +0.9%.  Other sectors were little changed.

NH-NL Cumulative continued to move higher creating a buffer if the market does pull-back in the near future.


Tomorrow, Australia will see CPI figures for the December quarter.  That has the potential for a market moving event.

Stay Safe.


Finspiration Australia. Chart Analysis for Australian and International Stock Markets + Bitcoi

   24/1/2023.  Finspiration Tuesday Morning Report.

U.S. sees follow through buying after Friday's good result.


Dow Jones +0.76%.  SP500 +1.19%.  Nasdaq +2.01%.  Small Caps +1.1%.  Banks +2.1%.

SP500.


SP500 is now back to the down sloping trend line where it has failed before.  Crucial time.

Commodities.

Commodities showed modest strength last night.


Commodities Index +0.24%.  Energy +1.01%.  Base Metals +0.27%.  Agriculture +0.15%.  Gold +0.19%.

Gold is consolidating at its highs, so there is a good chance of further upside.

Bitcoin.

Bitcoin was up +3% last night.   It finished above the 200-Day MA.  That's a big plus.

Negative divergences are starting to show up on indicators so a consolidation or pull-back might be on the cards.  A modest pull-back could provide a chance for bitcoin punters to get set for another surge to the upside.

Finspiration Australia. Chart Analysis for Australian and International Stoc Markets.

23/1/23.  Finspiration Monday Evening Report.

XJO up just +0.07% today.


 The market was indecisive today recording a narrow range doji candlestick.

It remains overbought with an RSI >70.  CCI is showing a negative divergence which suggests we will see a pull-bcumack in the near future.

Information Tech +1.3% and Energy +0.9% were the best performing sectors.  Other sectors were in a narrow range exhibiting "noise".

NH-NL Cumulative continued to move higher creating a buffer if the market does pull-back in the near future.


Saturday, January 21, 2023

Finspiration Australia. Chart Analysis for Australian and International Stock Markets.

22/1/23.  Weekend Report - The Week That Was.  Week Ended 20/1/23.

Stock Market Adage:  "As goes January, so goes the year."  Described first by Yale Hirsch in 1972, since 1950 it has an 85.7% accuracy

 Chart Analysis on this Blog is purely descriptive.  It is written for informational and educational purposes and should not be taken as financial advice.  Do your own research or seek advice from a Registered Financial Advisor.

This week saw further upside in the broad market.

XJO Monthly Chart.


The first three weeks of the new month of January, 2023 have been good for the XJO, up + 5.88%.   The Index is above the 8-MEMA, Hull MA13, 50-MMA, 200MMA, SUpertrend (7/15).  Supertrend was the last domino to fall.  If it remains bullish into the end of January (and I see no reason why it shouldn't), we can say we have a new bull market on our hands.

Monthly RSI is at 56.98

XJO Weekly Chart.


In the past five days, XJO risen +1.69%.  XJO Weekly is in an uptrend - higher highs and higher lows.

8-Week EMA, Hull MA13 and Supertrend are all heading to the upside.

Weekly RSI is at 63.69.  That's above the Monthly RSI of 56.98, which indicates a bullish XJO.


XJO Daily Chart.


XJO has been in a strong up-trend since early January.  Daily RSI is now at 72.09 - that's overbought.  The last time XJO had an overbought reading was back in early December, 2022, which precipitated a fall back to the 200-Day MA.  Watch the market here for a pull-back.  I'd expect support at the 50-Day MA, which be about a 50% retracement of the recent rise.

Monthly, Weekly and Daily RSIs. - Sectors + XJO + Gold + Composite Bonds


The above column chart shows the Monthly, Weekly and Daily RSIs for each sector.  This provides information momentum.

Bullish Momentum:  slope upwards from left to right.
Bearish Momentum:  slope downwards from left to right.

Sectors to watch.  
  • A.  First two columns slop upwards, third column is below second column.  May be in a pull-back in a bullish trend.
  • B.  Second Column is below first column, but third column is above second column.  May be in a counter-trend rally

This week we have nine sectors with bullish readings:  XXJ, XMJ, XDJ,  XIJ, XTJ, XHJ, XPJ, XSJ, XNJ. As well, the following show bullish readings:  XGD, XJO, IAF

Bearish readings:  XEJ, XHJ. XSJ is bearish in the medium to long-term but showing a short-term bounce.

XUJ is bearish, and XEJ is in a counter-trend, upside rally.

XMJ and XJO are short-term overbought with RSI >70.  Expect consolidation or a pull-back in the coming week.


NewHighs-NewLows Cumulative.

This is a long-term lagging indicator.


NH-NL Cum is represented by the blue line.  It is now above the 10/21/34 Day Moving Averages.  The 10-DMA is above the 21-DMA.  This is a very bullish configuration.  While the NH-NL CUM remains above the 10-Day MA, long-term investors can fell comfortable about their investments.

I've developed another long-term metric "StrongStocks-WeakStocks" which is similar to NH-NL but gives signals a little earlier than NH-NL  SS-WS is up for the 10th week in a row and has moved well above its 5-Week MA.   This week there were 38 Strong Stocks and 1 Weak Stock.   That's the best result since I began keeping records two years ago and beats the record set the previous week.  This chart remains bullish.

% of Stocks above key moving averages.

1.  % of stocks above 10-Day Moving Average: Last Week 78%, This Week 66%.  
2.  % of stocks above 50-Day Moving Average, Last Week 70%, This Week 77%.  
3.  % of stocks above 200-Day Moving Average, Last Week 52%, This Week 64%.  

All three indicators are now bullish.  The short term indicator (stocks above 10DMA) has fallen back from the previous week's reading.  That's interesting as the XJO is giving off an overbought reading, so internal strength is weakening.  That usually happens before a pull-back.  

Conclusion.
 
January has started well for the XJO and most Sectors are now giving bullish momentum readings..

XJO is now overbought with an overbought RSI >70.  XMJ is also >70 for the second week in a row.

Internal strength has weakened a little which usually happens before a pull-back.  I won't be surprised to see a pull-back start in the coming week.  

I said that in the previous week's report on the basis of the overbought reading for XMJ.  XMJ retained that reading this week, which only makes the idea of a pull-back more pronounced.

The long-term out-look for our market (based on the January effect and NH-NL Cum) remains good.

Stay Safe. 

Finspiration Australia. 14/11/23. Tues. Morning Report.

Mixed Results in New York.  Energy up. NAB ex-dividend today. Dow Jones +0.16%.  SP500 -0.08%.  Nasdaq -0.11%.  Small Caps -0.07%.  Banks -0...