Friday, September 30, 2022

Finspiration Australia. Chart Analysis for Australian and International Stock Markets. +Bitcoin.

1/10/22/. American stocks continue to tumble.


 Dow Jones -1.71%.  SP500 -1.51%.  Nasdaq -1.51%.  Small Caps -0.65%.  Banks -0.84%.

SP500.


SP500 is again extremely oversold with an RSI at 28.47 but showing a small positive divergence.

Stochastic remains in its oversold zone.  While it remains in that oversold zone, it is best to resist the temptation to re-enter the market.

A big positive divergence remains on MACD Histogram, that continues to suggest that SP500 is reaching for a bottom and a sustained counter-trend rally is possible.
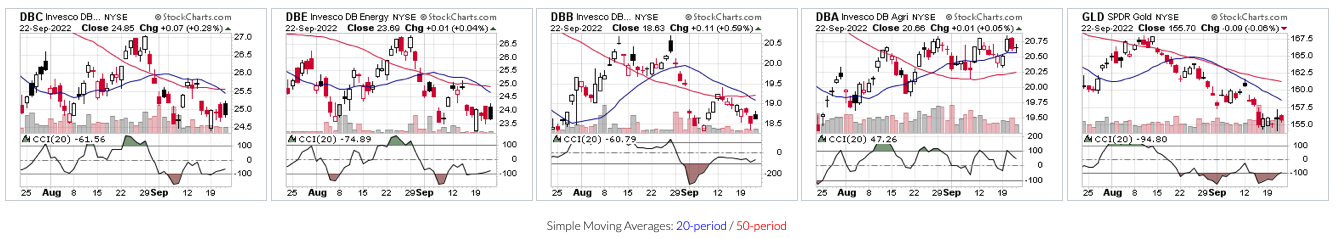
Commodities.


Commodities continue to suffer along with stocks.  Commodities Index -1.24%.  Energy -1.74%.  Base Metals -2.08%.  Agriculture -0.65%.  Gold flat +0.01%.  The long upper wick on the Gold candle suggests intra-day selling after Gold tested the 20-Day MA.  Not a good sign for Gold.

Yesterday in Australia.

XJO fell heavily yesterday -1.23%.  It remains in a consolidation pattern after hitting the lower edge of the expanding wedge on Monday.  Until XJO breaks above the upper edge of the expanding wedge, it is best to stay on the sidelines.

Bitcoin.


Bitcoin is up +0.19% in low conviction trading.  The chart has formed a "saucepan" bottom which could lead to a counter-trend rally.  Just don't expect too much from it.


Thursday, September 29, 2022

Finspiration Australia. Chart Analysis for Australian and International Stock Markets. + bitcoin.

 30/9/22.  Overnight in America, stocks fall heavily


.

Dow Jones -1.54%.  SP500 -2.11%.  Nasdaq -2.84%.  Small Caps -2.09%.  Banks -1.57%.

SP500.


This action looks like a test of the recent low.  The index remains very oversold on the RSI at 30.97.  Stochastic remains in its oversold zone.

Good positive divergences remain on MACD Histogram and CCI which suggest a move to the upside is likely.  Just don't jump the gun.

Commodities.


Commodities Index -0.62%.  Energy -0.95%.  Base Metals +2.24%.  Agriculture flat +0.05%.  Gold flat -0.02%.

Iron ore flat. -0.1%.

Overnight oz Futures -0.4% - that guarantees a poor start to today's trading.  After 30 minutes of trading, XJO is down about -0.6%.

Bitcoin.


Bitcoin is currently up +0.3% in low conviction trading.

The chart has, however, formed a "saucepan bottom" which often translates into a momentum move to the upside.  Any counter-trend movement will probably be sold into.


Finspiration Australia. Chart Analysis for Australian and International Stock Markets. +Bitcoin.

29/9/22.  ASX up strongly today.


 Today was a strong up-surge off support.  The lower edge of the descending wedge is holding.

My turn date of 26/9/22 is also looking good.

We only have to look at overhead resistance, however, to see that progress from here-on will be turgid.

Expect a head-ache/hangover after today's excessive exuberance.  Tomorrow is likely to be moderate or to the downside.

Breadth today was good.  Advances/Declines came in at 920/446.  That's a very positive result.

No sectors were negative today.  The resources did best.  Energy +2.8%, Materials +2.2%.

Tomorrow might be down but momentum is likely to push the market higher for a few more days.

Wednesday, September 28, 2022

Finspiration Australia. Chart Analysis for Australian and International Stock Markets +Bitcoin

 29/9/22 Overnight.  BoE buys bonds.  Stocks rally.


Dow Jones +1.88%.  SP500 +1.97%.  Nasdaq +2.05%.  Small Caps +2.77%.  Banks +2.09%.

SP500.


SP500 responded well to the BoE actions (which flowed through to American bonds).  The current candle is a bullish engulfing candle which should result in further short-term upside action.

Commodities.

Commodities also responded positively to the action in Bond markets.  Commodities Index +2.78%.  Energy +3.43%.  Base Metals +2%.  Agriculture +0.85%.  Gold +2.08%.

Iron Ore -0.2%.

Overnight Oz Futures are gung-ho, up +1.5%.  Our market should follow the U.S. higher.

Bitcoin.


Bitcoin is currently down -0.87%.  The overall picture has changed, which is bearish.  Short-term it might produce some upside, but strong overhead resistance remains.  Any rally is likely to be sold into.

Finspiration Australia. Chart analysis for Australian and International Stock Markets. +Bitcoin.

 28/9/22.  ASX falls today after an early rise.


XJO finished down today -0.53%.  It continues to respect as support the lower edge of the expanding wedge.  The index remains oversold at 31.67.  The next move is likely to be to the upside.


Finspiration Australia. Chart Analysis for Australian and International Stock Markets. +Bitcoin

 28/9/22.  After a positive start, ASX falls into negative territory.


Although down today, XJO continues to respect the lower edge of the descending expanding wedge.

Expect the next major move to be to the upside.

Bitcoin.


Bitcoin slid lower today, down -1.75%.  It remains bearish.

Unless you are a sharp intra-day trader, I think it is best to give Bitcoin a miss.  It is in a slow descending market.  Not a lot of opportunities for a medium term trader.

Tuesday, September 27, 2022

Finspiration Australia. Chart Analysis for Australian and International Stock Markets +BITCOIN

 28/9/22.  Overnight in America - choppy trading, mixed results in stocks.


Dow Jones -0.43%.  SP500 -0.21%.  Nasdaq +0.25%.  Small Caps +0.08%.  Banks -0.94%

SP500.


SP500 seems to be searching for a bottom.  

Last night, RSI finished extremely oversold at 26.86.  Below 30 is extremely oversold.  Stochastic remains in its oversold zone, it needs to get back above 20 before we have a chance of a solid rebound.

Commodities.  Like stocks - mixed results.


Commodities Index +1.07%.  Energy +1.72%.  Base Metals -1.13%.  Agriculture +0.2%.  Gold +0.2%.

Iron Ore -0.3%.

Overnight Oz Futures -0.7%.  

Bitcoin.


Bitcoin is currently up just +0.18%.

Looking at the chart, we can see long series of doji candlesticks - indicating little conviction by traders in direction of the crypto.  Occasionally there is a solid candlestick, but the chart is dominated by series of doji candles.

There seems to be little chance of a sustained bull market while interest rates continue to rise.

Finspiration Australia. Chart Analysis for Australian and International Stock Markets +bitcoin

 27/9/22.  Oz stocks rise despite poor overnight leads from U.S. and Commodities.

XJO up today +0.41%,  That stemmed the flow of blood from yesterday's big fall.

Today's action is a narrow-range day, within the range of yesterday.  That is still indecisive.  It does, however, hold at the lower edge of the bullish expanding wedge.

Today's action is positive in the face of negative overnight action overseas.  ASX is probably pre-empting action tonight overseas.  XJO often takes pre-emptive action.  Expect a better night in overseas markets tonight.

Breadth today was poor.  Despite the positive finish Advance and Declines were 691/703.  NewHighs/NewLows 6/140.

Five sectors out of twelve were up today.  That explains the poor breadth numbers.  We need to see improvement in those numbers for a sustainable rally.

Best sectors today were:  Materials +2.6%, Energy +1.7%.  Consumer Discretionary +0.2%.  Consumer Staples +0.2%.  Information Technology +0.5%


Monday, September 26, 2022

Finspiration Australia. Chart Analysis for Australian and International Stock Markets +BITCOIN.

 27/9/22.  Overnight in America.  Stocks fall again in America.


Dow Jones -1.11%.  SP500 -1.03%.  Nasdaq -0.6%.  Small Caps -1.52%.  Banks -1.83%.

SP500.

SP500 is now down for the fifth day in a row.  On the RSI it is extremely oversold at 27.2 and right at horizontal support of the June lows.

I'd expect the Index to bounce here.

Commodities.


Commodities continue to suffer along with stocks.  Commodities Index -2.33%.  Energy -2.73%.  Base Metals -2.31%.  Agriculture -1.63%.  Gold -1.15%.

Iron Ore +0.1%.

Despite poor overnight leads for stocks and commodities, the Australian market has opened higher.  After 25 minutes of trading, XJO is up +0.45%.  Materials and Energy have rebounded from yesterday's steep sell-off.

Finspiration Australia. Chart Analysis for Australian and International Stock Markets +BITCOIN

26/9/22.  XJO falls heavily again today.


 XJO fell today -1.6%.

The Index is very oversold with an RSI at 30.94 and Stochastic deep into its oversold zone (below 20).

The chart has reached the lower edge of its bullish descending expanding wedge, so there is a good chance that a counter-trend rally is likely.

Breadth was poor today, Advances 268, Declines 1217 for a net figure A-D of -949.  That's the worst result since 9 May this year.

New Highs today 7,  New Lows 204.  That's the worst result since 10 May this year.

XJO began a relief rally on 13 May.  So we are probably close to the end of this pull-back.

Defensive stocks came to the fore today, e.g.,  CSL +2.4%, COH 2.9%, WOW +2.4%, COL +1.96%.  But the market was smashed by big falls in resource stocks, BHP -5.2%, RIO -5.6%, Woodside -5%, Santos -7.28%.  Coal miners have been the best performers in recent times, but they also came under attack today, e.g., WHC -14.2%.

Five out of eleven sectors were up today, but the Materials were down -5.3% and Energy -6.3%.  Those two sectors were responsible for most of the damage today.

I'm expecting our market to be up tomorrow. 


Saturday, September 24, 2022

Finspiration Australia. Chart Analysis for Australian and International Stock Markets.


         Weekly Wrap - Week ending 30 September, 2022.  

XJO Monthly Chart.
We are now at the end of the month.  September is historically a poor month in the market, and this September hasn't deviated from the trend.  XJO down in September, 512.6 points, or  -7.34%.  

The chart has broken marginally below the 50-Month Moving Average which gave support in June/July. It has finished, however, above the intra-month low of June.

The chart is bearish.  On the basis of this chart, longterm investors should stay on the sidelines.  


 Both Supertrend Lines remain blue (bearish).  The chart remains below the 8-Month EMA which is heading downward, i.e. bearish.  Hull MA13 is headed down - bearish.  Hull MA13 is the most sensitive of these.  It turned down first in Oct. 2021.  We'll be looking for a turn up in Oct. 2022 - a one-year anniversary.  Mid-October is often a turning point in down trends.

Weekly Chart.


XJO was down this week -1.53%, continuing the plunge from the two previous weeks.  The chart remains bearish.  The chart closed just below the 200-Week MA where it found support in late June.

XJO found resistance at the 50-Week MA.  Those two MAs 50-Week and 200-Week appear to be important dynamic support/resistance areas.  Further down side could see the market test the low of March, 2020.  

Two Supertrend lines are blue - bearish.  Hull MA13 is headed down - bearish.

The Weekly Chart is in sync with the Monthly Chart - both Bearish.


Daily Chart.


XJO remains in a bearish down trend.  Daily, weekly and monthly are in sync - bearish.

Looking at the tea-leaves provides some hope of a rebound.  The XJO is oversold with an RSI at 34.58.  Stochastic is in its oversold zone.  

XJO has found support at the oblique supporting trend line.  I had a turn date using WD Gann methods for the 26 Sept.  In the short-term that stopped the down-trend, but reversion to the upside hasn't occurred.  

The chart remains bearish and XJO on all three time frames (monthly, weekly, daily) remain in sync.  Bearish.  Any upside is likely to be sold into until we see more optimism in the longer time-frames.   

SP500 Daily.


RSI is very oversold at 35.3.  Stochastic is in its oversold zone.

At this stage, a move to the upside is speculative - but it should not be discounted.

Sector Strengths by RSI.


RSI (Relative Strength Index) is calculated using the default setting of 14 days - almost three weeks of trading.  It provides a more reliable guide to changes in sectors than the one-week results which can jerk around quite a lot and, thus, RSI is probably a more reliable guide to recent strength in the sectors. (Click here for a description of RSI.)

Eleven of eleven sectors have readings below 50.  50 is often regarded as  dividing line between bullish and bearish. With all sectors below 50, we have a very bearish market with weak breadth.

The best two sectors are the resources, XEJ and XMJ.

This week we again have four sectors below 30 - XTJ, XHJ, XUJ and XPJ.  XSJ and XDJ (the big retailers) are just above the 30 level.  

This is an exceptionally weak market with poor breadth.


Breadth:

    1. New Highs - New Lows Cumulative.


This week saw NH-NL very bearish, four out of five days saw NH-NL greater than -100.  The last time we saw a series like this was back in March, 2020, during the bear market of 2020.  Readings back then were more extreme than the current ones, so we could have some more extreme readings coming in the near future.

This indicator trends strongly.  Only when we see a clear break to the upside, preferably with the 10-DMA above the 20-DMA, should long-term investors be willing to invest new funds.

    2.  Strong Stocks - Weak Stocks Cumulative.

This is a metric of my own making.  All stocks on the ASX100 are rated on seven criteria.  Stocks positive on all seven criteria are rated "Strong".  All stocks negative on all seven criteria are rated "Weak".


This indicator trends strongly.  Only when we see a clear break to the upside, should long-term investors be willing to invest new funds.


This chart remains below its Five-Week MA, which is a bearish reading.  This is a reasonable guide for medium term traders.

% of Stocks above key moving averages.

1.  % of stocks above 10-Day Moving Average: Last Week 5%, This Week 13%.  Any reading under 20 is very weak.
2.  % of stocks above 50-Day Moving Average, Last Week 11%, This Week 12%.  
3.  % of stocks above 200-Day Moving Average, Last Week 19%, This Week 16%.  That's the worst reading since May, 2020.


Momentum is now nearly as bad as we saw at the end of the 2020 bear market.  We can't be far off  an end to this down trend.  At worst, one more month of bearish sentiment should see a turn-around.  The bear market of 2020 saw multiple readings below 10 - we might have to see similar readings this time.

SENTIMENT.


1.  CNN Fear and Greed Barometer.


F&G Index is showing Extreme Fear - it is lower than a week ago.  It can go lower.  An "extreme fear" reading registers with contrarians that a rebound is likely.

Conclusion.

Markets are very weak.  They may have further to go.  But don't discount a move to the upside. It is not far off.

Stay safe.


Friday, September 23, 2022

Finspiration Australia. Chart Analysis for Australian and International Stock Markets. +BITCOIN.

 24/9/22.  Overnight in America.  Stocks fall again.  "How low can you go?"


Dow Jones -1.62%.  SP500 -1.72%.  Nasdaq -1.8%.  Small Caps -2.23%.  Banks -1.97%.

SP500.


SP500 is now extremely oversold with an RSI at 28.9.  Rarely does a major index show such a low reading without bouncing to the upside.  Of course, oversold can always go more oversold, so don't jump the gun.  A more by Stochastic back above the oversold zone (below 20) would be a "get set" signal.

The risk to the upside is now much better than the risk to the downside.  Traders will do well here.

Any move to the upside will likely be sold into.

Below is a six-month chart for SP500:


I've added this chart because we can see that SP500 is now down, more or less, to the June low.  That's an important support level.  Give the extremely oversold nature of SP500, that reinforces the idea that the Index is poised for a move to the upside.

Commodities.


Commodities had huge falls last night.  Commodities Index -3.39%.  Energy -4.09%.  Base Metals -2.58%.  Agriculture -1.94%.  Gold -1.73%.

Commodities are generally very oversold with RSIs down in the low 30s.  Look for a rebound in the next few days.

Yesterday in Australia.

XJO fell heavily on Friday -1.87%.  RSI is at 34.58, so not as oversold as SP500, but that could change on Monday.

The Index is opposite a congestion zone from July which might offer support.  If America does revert to the upside, we should follow suit.

Bitcoin.


In week-end trading, Bitcoin is up +1.73%,  but the chart remains in bearish territory.

Positive divergences on indicators suggest that Bitcoin could stage a counter-trend rally.  Nimble traders could benefit from such a move.


Thursday, September 22, 2022

Finspiration Australia. Chart Analysis for Australian and International Stock Markets + BITCOIN

 23/9/22.  Overnight in America, stocks ease down again after FOMC.

Dow Jones -0.36%.  SP500 -0.84%.  Nasdaq -1.37%.  Small Caps -2.1%.  Banks -2.48%.

10-Yr Treasuries rose to an 11-year high of 3.71%.

SP500.


SP500 remains in its down-trend.  

RSI is very oversold at 32.06, which raises the possibility of a trend reversal.  First sign would be a move by Stochastic out of its oversold zone, going above 20.  The market can remain oversold for much longer than expected, so don't jump the gun.

Using WD Gann principles, I have a turn date of 26/9/22 which is Monday.  Don't expect precision with these calculations, but they're usually not far out - so expect a reversal to the upside in the next few days.

Commodities.

Commodities Index suffered intra-day selling but managed a rise of +0.28%.  Energy flat +0.04%.  Base Metals +0.59%.  Agriculture flat +0.05%.  Gold flat -0.06%.

Iron Ore managed a small rise, +0.2%.  

To start the day, ASX is down heavily.  XJO -1.2%.

BITCOIN.


Bitcoin is currently up about +0.6% but remains bearish.

Indicators are showing positive divergences, so the chance of a counter-trend rally remains possible.

Traders could make good money here, but don't expect any rally to last for too long.


Wednesday, September 21, 2022

Finspiration Australia. Chart Analysis for Australian and International Stock Markets + BITCOIN.

 22/9/22.  Overnight in America, Fed announces interest rate rise, stocks fall.


Dow Jones -1.7%.  SP500 -1.71%.  Nasdaq -1.79%.  Small Caps -1.14%.  Banks -2.12%.

As expected, the Fed raised its key interest rate by 75 basis points, i.e, three-quarters of a percent.  The mood of the market changed as Fed Head Powell spoke about the meeting's deliberations.  Forty minutes after the IR announcement, SP500 was in positive territory, but a sharp slide in the last hour of trading saw the Index fall sharply.

SP500.

SP500 is now down to the lower end of the congestion zone seen at the left-hand side of the chart.

RSI is oversold at 33.74 and Stochastic remains in its oversold zone.

Watch for a trend reversal.  First sign would be a rise by Stochastic out of its oversold zone.

Commodities.


Commodities Index -0.6%.  Energy -0.46%.  Base Metals -1.4%.  Agriculture -0.57%.  Gold +0.46%.

The Australian market is closed today for the National Day of Mourning.

IG runs a synthetic market for Australia in lieu of the ASX - it is currently down -1.13%.

BITCOIN.


Bitcoin is currently down -2.6%, which is a new low.

That no doubt is a reaction to the Fed's interest rate rise.  Since Bitcoin provides no direct revenue it's not surprising that traders/investors are switching out of Bitcoin into other more enticing assets - e.g, cash which can earn interest.

That fall also puts a big question mark over my idea that this consolidation represented accumulation rather than distribution.

The crypto remains oversold so I'm not ruling out a counter-trend rally.  A return to a bull market?  That is looking less and less likely with more interest rates on the way.

Finspiration Australia. Chart Analysis for Australian and International Stock Markets.

 21/9/22.  XJO down heavily today.


XJO down today -1.56%.

Well, that wasn't very nice.  Yesterday the market gave us a short-term bullish signal, and today it took that off the table with a bearish engulfing candle.

hmm.  Looks to me like our masters are putting the bejesus up us.

Down today, up tomorrow?

Who knows?

The XJO remains primed for a move to the upside with Stochastic down in the oversold zone.

Some indicators have positive divergences.  Just look at CCI.

We have the Federal Reserve announcement on interest rates - about 2.30 a.m. Oz time.

I'm expecting that to result in a move to the upside as the current probable interest rate rise is already built into prices.

Finspiration Australia. 14/11/23. Tues. Morning Report.

Mixed Results in New York.  Energy up. NAB ex-dividend today. Dow Jones +0.16%.  SP500 -0.08%.  Nasdaq -0.11%.  Small Caps -0.07%.  Banks -0...